
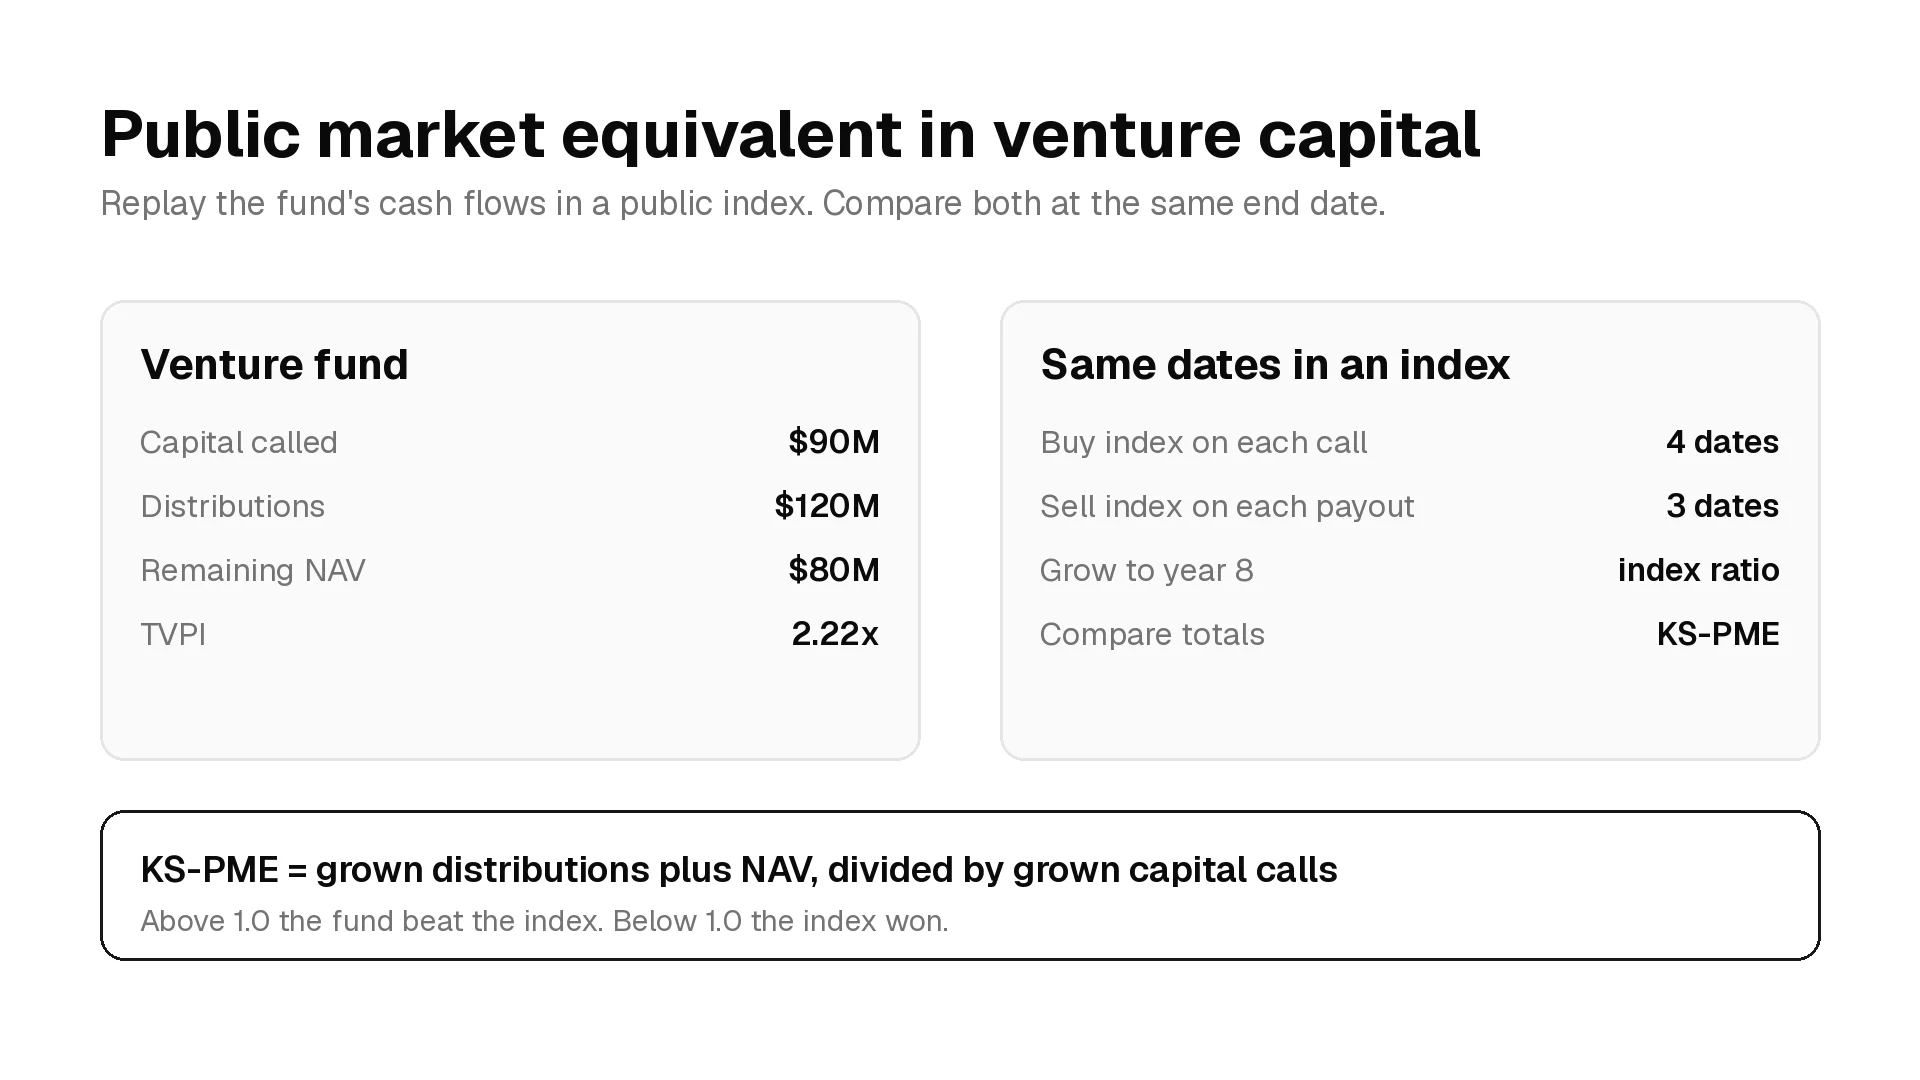
Public market equivalent, or PME, measures whether a venture fund beat what its LPs would have earned by putting the same cash into a public index on the same dates. The most common version, KS-PME, is a ratio. Above 1.0 the fund beat the index. Below 1.0 the index won. Because the answer depends on which index you pick, the same fund can look like a winner against the S&P 500 and a laggard against the Nasdaq.
What public market equivalent measures
Every dollar an LP commits to a venture fund is a dollar it could have left in public stocks. PME prices that opportunity cost. It takes the fund's actual capital calls and distributions, replays them as purchases and sales of an index, and compares the two outcomes at the same end date.
Two details make PME different from a simple "VC returned 15%, the S&P returned 10%" comparison:
- Dates come from the fund. LPs do not wire their full commitment on day one. Money goes out over the capital call schedule and comes back as companies exit. PME invests and withdraws index money on those exact dates.
- The result is relative. A fund with a 15% IRR can fail a PME test if public markets ran hot over the same years. A fund with an 8% IRR can pass if it was raised just before a crash.
The method most people mean by PME traces back to Steven Kaplan and Antoinette Schoar, whose NBER working paper on private equity performance compared fund cash flows with the S&P 500 and found that average fund returns net of fees roughly equalled the index over their sample period.
Why IRR and TVPI are not enough
The five core fund metrics tell you how much money a fund made and how fast. None of them tell you whether that was good relative to the alternative.
| Metric | Question it answers | What it misses |
|---|---|---|
| TVPI | How much value per dollar paid in? | Time, and what public markets did |
| DPI | How much cash came back? | Whether the cash beat an index |
| IRR | How fast did money compound? | Market tailwinds over the fund's life |
| KS-PME | Did the fund beat an index on the same dates? | Absolute size of the gain |
IRR has a second weakness. It rewards early distributions heavily, so a fund that returns a little cash quickly can show a strong IRR while creating modest dollars. PME weights each cash flow by what the index did after that date, which damps that effect.
A vintage-year peer ranking answers a third question, whether the fund beat other venture funds. PME answers whether venture beat public stocks for that LP. Serious LPs look at both.
How to calculate KS-PME: a worked example
The numbers below are illustrative. They are built to show each step, not to describe any real fund.
The fund's cash flows
A fund calls $90M from LPs over four years, returns $120M in years 5 to 7, and still holds $80M of portfolio value, or NAV, at the end of year 8. On fund metrics alone it looks good: TVPI 2.22x, DPI 1.33x, IRR 15.1%.
Over the same eight years a broad stock index rises from 100 to 160, about 6.1% a year.
Step-by-step calculation
- List every capital call and distribution with its date.
- Record the index level on each date and at the end date.
- Grow each cash flow to the end date by multiplying it by the end index level divided by the index level on its date.
- Add the grown distributions and the ending NAV. NAV is already at the end date, so it is not grown.
- Divide that total by the grown capital calls. The result is KS-PME.
| Year | Cash flow | Index level | Growth factor to year 8 | Value at year 8 |
|---|---|---|---|---|
| 0 | Call $25M | 100 | 1.600 | $40.0M |
| 1 | Call $25M | 108 | 1.481 | $37.0M |
| 2 | Call $25M | 104 | 1.538 | $38.5M |
| 3 | Call $15M | 118 | 1.356 | $20.3M |
| 5 | Distribution $20M | 135 | 1.185 | $23.7M |
| 6 | Distribution $40M | 146 | 1.096 | $43.8M |
| 7 | Distribution $60M | 152 | 1.053 | $63.2M |
| 8 | NAV $80M | 160 | 1.000 | $80.0M |
Grown calls total $135.8M. Grown distributions plus NAV total $210.7M. KS-PME is 210.7 divided by 135.8, or 1.55. LPs ended with about 55% more value than the same cash in the index would have produced.
Direct alpha from the same numbers
Direct alpha turns the same comparison into an annual rate. Take the grown cash flows from the table, treat calls as negative and distributions plus NAV as positive, and compute their IRR. For this fund the answer is 8.1% a year. That is the return the fund earned on top of the index, per year, after matching dates.
KS-PME says how much better. Direct alpha says how much better per year. The annual figure is easier to compare across funds of different ages.
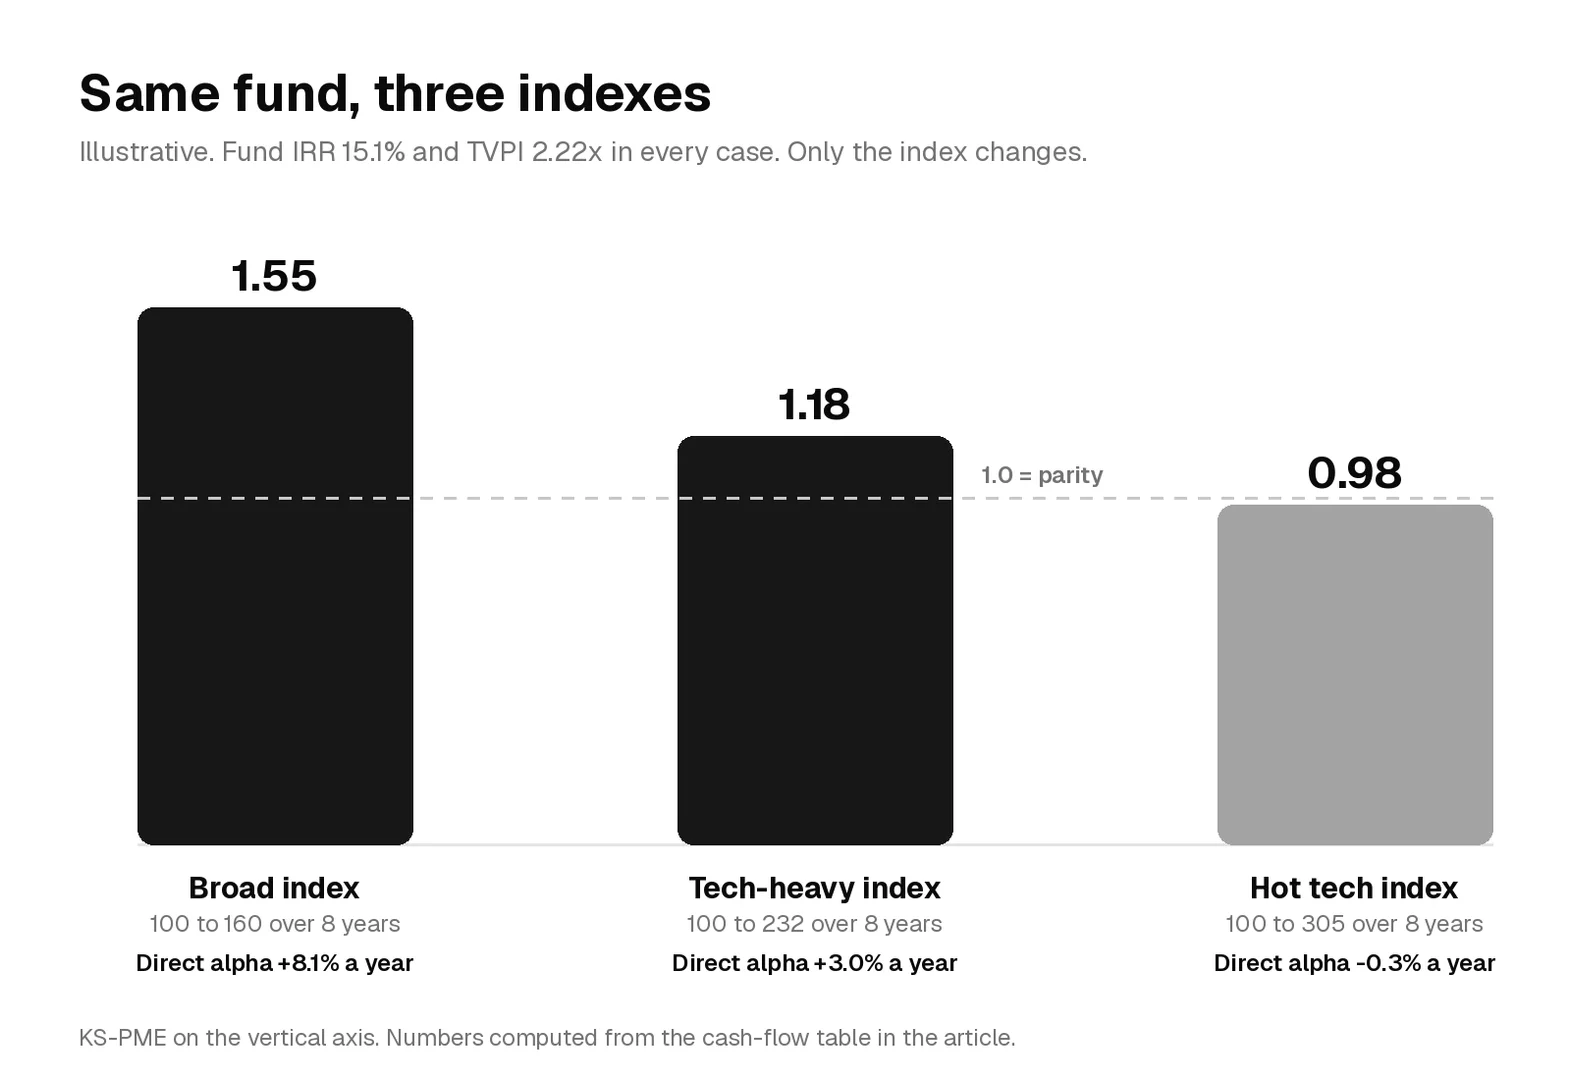
Run the same fund against a tech-heavy index that rises from 100 to 232 and KS-PME falls to 1.18, with direct alpha of 3.0%. Against an index that triples to 305, KS-PME is 0.98 and direct alpha is minus 0.3%. The fund's 15.1% IRR is slightly above that index's 15.0% annual return, yet PME says the fund lost. Timing explains it. The fund called most of its money early, right before the index's biggest gains.
PME methods compared
Most disagreements about "the PME" are really disagreements about method. Each one answers a slightly different question.
| Method | Output | How it works | Watch out for |
|---|---|---|---|
| KS-PME | Ratio, 1.0 is parity | Grows calls and distributions by the index and divides | Says nothing about time; a 1.3 over 3 years and over 12 years are not equal |
| Direct alpha | Annual excess return | IRR of index-adjusted cash flows | Harder to explain to non-specialists |
| Long-Nickels PME | Index IRR to set beside fund IRR | Buys index on calls, sells on distributions, compares IRRs | Large distributions can drive the index position below zero |
| PME+ | Index IRR | Scales distributions so the index position ends equal to fund NAV | Adds a scaling assumption |
| Modified PME, or mPME | Index IRR plus a spread in basis points | Sells index shares in the same proportion the fund distributes | Method used by Cambridge Associates; compare spreads, not raw IRRs |
If someone quotes a PME without naming the method and the index, ask for both before you draw a conclusion.
Choosing the public index
The index is part of the answer, not a detail. A broad index such as the S&P 500 or MSCI ACWI represents what a typical institutional LP would otherwise own. A tech-heavy index such as the Nasdaq Composite is closer to the sector mix of most venture portfolios, and it is a much harder bar. A small-cap index such as the Russell 2000 matches company size better than sector.
Test against the index the LP actually holds, then against the closest sector match. If outperformance survives both, it is real. If it only appears against the easiest index, treat it as a marketing number.
What the Cambridge Associates data shows
Cambridge Associates publishes its US Venture Capital Index next to mPME returns for three public indexes. The figures below are from its calendar year 2025 benchmark commentary, published July 30, 2026, for periods ended December 31, 2025. The venture index is a pooled IRR, net of fees, expenses and carried interest.
| Horizon | CA US Venture Capital | S&P 500 mPME | Nasdaq mPME | Russell 2000 mPME |
|---|---|---|---|---|
| 1 year | 21.1% | 18.0% | 21.3% | 13.3% |
| 3 years | 8.7% | 22.8% | 31.1% | 13.8% |
| 5 years | 10.2% | 14.8% | 14.0% | 6.8% |
| 10 years | 14.9% | 15.0% | 17.8% | 9.7% |
| 15 years | 15.5% | 14.2% | 16.7% | 9.7% |
| 20 years | 12.9% | 11.3% | 13.7% | 8.6% |
| 25 years | 8.1% | 9.9% | 11.7% | 8.8% |
Read across the rows and the index choice decides the story. US venture beat the Russell 2000 equivalent in five of seven horizons. It beat the S&P 500 equivalent over 1, 15 and 20 years, and was a tenth of a point behind over 10 years. It trailed the Nasdaq equivalent in every horizon shown, including 2025 itself. These are pooled index figures. Individual funds spread far wider in both directions, which is why the power law matters more than the average.
How to read a PME result
| KS-PME | Plain reading | What to check next |
|---|---|---|
| Below 0.9 | The index clearly won | Whether the fund is still early in its J-curve |
| 0.9 to 1.1 | Roughly in line with the index | Whether the gap pays for illiquidity and fees |
| 1.1 to 1.3 | Meaningful outperformance | How much of it is still unrealized NAV |
| Above 1.3 | Strong outperformance | Concentration in one or two companies |
Three cautions apply to every PME:
- NAV is an estimate. In a young fund, most of the numerator is the GP's own marks. A 1.4 KS-PME with a DPI of 0.2x is mostly an opinion. Check DPI next to PME every time.
- Time is hidden in the ratio. KS-PME does not annualize. Use direct alpha or the mPME spread to compare funds of different ages.
- No index is risk-matched. Venture companies are smaller, younger and less liquid than index constituents. Many LPs want a premium over parity, not just a ratio above 1.0, before they call a fund a success.
What PME means if you work at a VC firm
PME is an LP tool, but the people who produce, defend and react to it sit inside VC firms. If you are interviewing for or working in venture, it shows up in more places than the investing team expects.
Who calculates and uses PME
| Role | Where PME shows up |
|---|---|
| Fund CFO, controller, fund operations | Builds the cash-flow ledger and NAV that every PME calculation starts from |
| Investor relations and fundraising | Puts PME in fundraising materials and answers LP diligence questions on method and index |
| Associate and principal | Portfolio marks feed NAV, so valuation calls move the fund's PME before any exit |
| Partner | Uses track-record PME to raise the next fund |
| LP-side analyst at an endowment, pension, fund of funds or family office | Runs PME across managers to decide re-ups and new commitments |
The fund accounting side owns the data. The LP side owns the judgment. Candidates who understand both can talk to either side of the LP and GP relationship.
PME and your carry
Carry in most venture LPAs is calculated on fund profits, sometimes after a fixed preferred return, not on performance against an index. A fund can pay carried interest and still post a KS-PME below 1.0. PME hits your carry indirectly. LPs use it when they decide whether to back the next fund, and your future carry depends on that fund existing.
Questions to ask a firm before you join
- Which index do you show LPs for PME, and does the result hold against the Nasdaq?
- What share of the current fund's value is realized? What are DPI and TVPI side by side?
- Which fund would my carry come from, and how far along is it?
- Has an LP ever pushed back on your PME method?
A firm that answers these plainly is usually a firm that reports plainly. Research its funds on the VC firm directory before the conversation.
How to answer a PME question in an interview
If asked how you would judge whether a fund performed well, a strong answer runs about 30 seconds:
"I would start with DPI to see how much is real cash, then TVPI and IRR. Then I would run a KS-PME against the index the LP would otherwise hold and against the Nasdaq, because venture is tech-heavy. If the fund only beats the broad index, the outperformance is mostly sector exposure. I would also check how much of the PME rests on unrealized marks."
That answer shows you know the metric, its main weakness and the trap in index choice. Pair it with the rest of your VC interview preparation.
Frequently asked questions
What is the difference between PME and TVPI?
TVPI divides total value by paid-in capital and ignores what else the money could have done. PME compares the same cash flows with a public index on the same dates. TVPI is absolute; PME is relative.
Can PME be calculated before a fund has exits?
Yes. Remaining NAV stands in for future distributions. The result is only as reliable as the marks, so early-fund PME should be read with DPI next to it.
What is a good KS-PME for a venture fund?
Above 1.0 means the fund beat the chosen index. Many LPs want a clear margin over 1.0 to compensate for illiquidity and fees, and they want it against more than one index.
Does every LP calculate PME the same way?
No. Methods, indexes and end dates vary, which is why two LPs in the same fund can report different PMEs. Always ask which method and which index produced a number.
Next steps
If fund mechanics like PME are what you want to work on, look at investor relations, fund finance and investing roles on the Venture Capital Careers job board. Create a free account to get new VC roles as they post.
Related posts
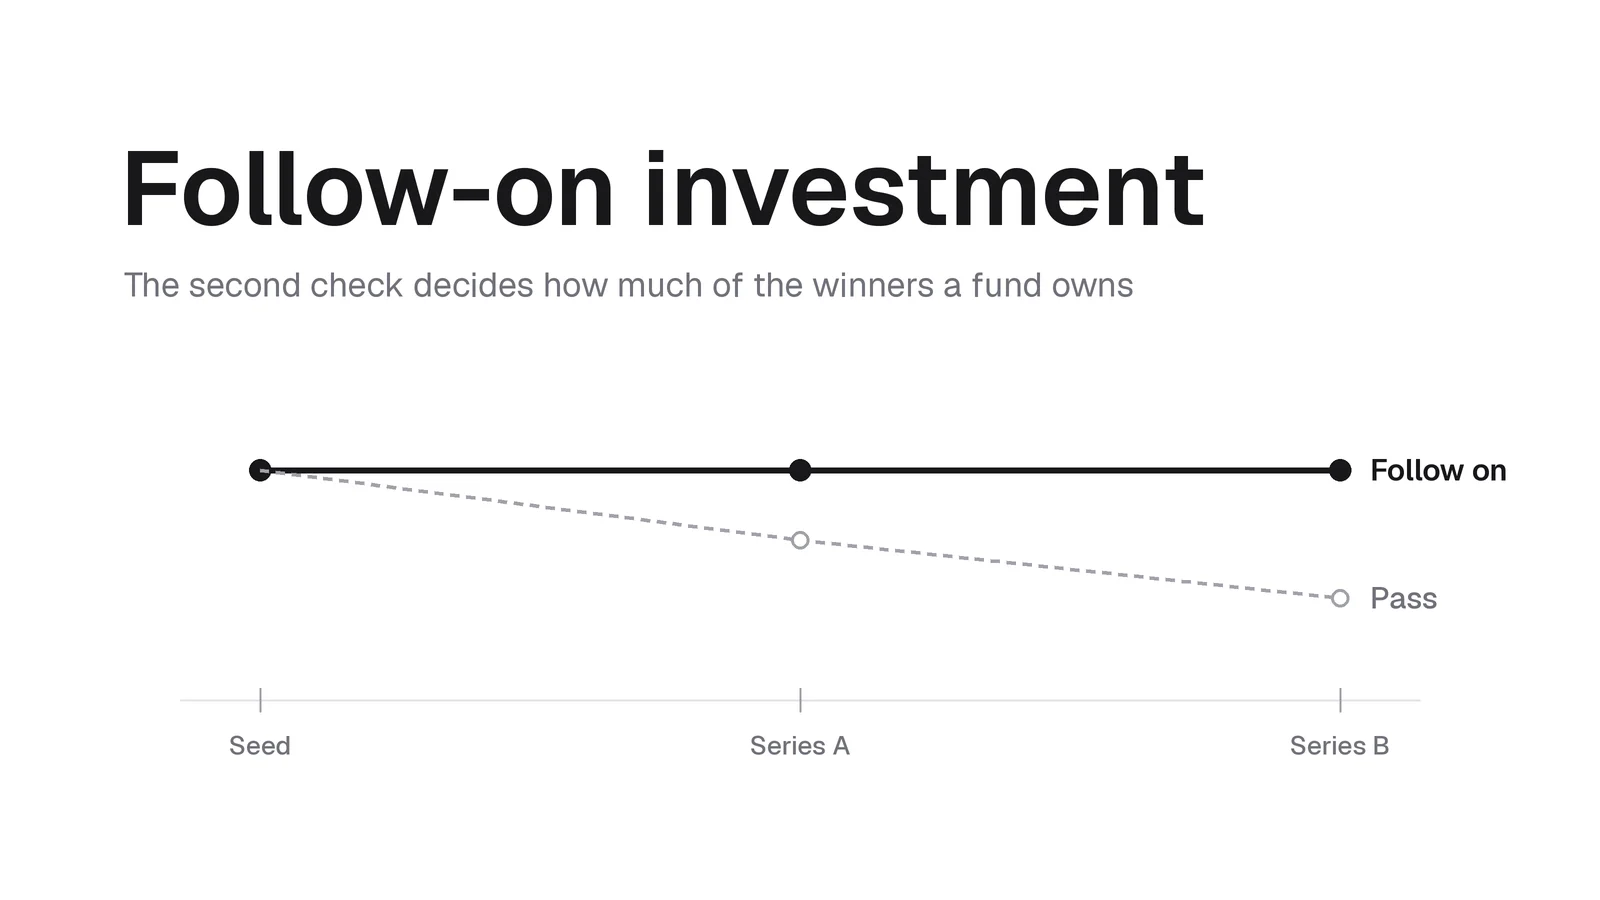
A follow-on investment is more capital from an existing investor in a company's later round. How pro rata, reserves, signaling, and the follow-on decision work, with two-round ownership math.
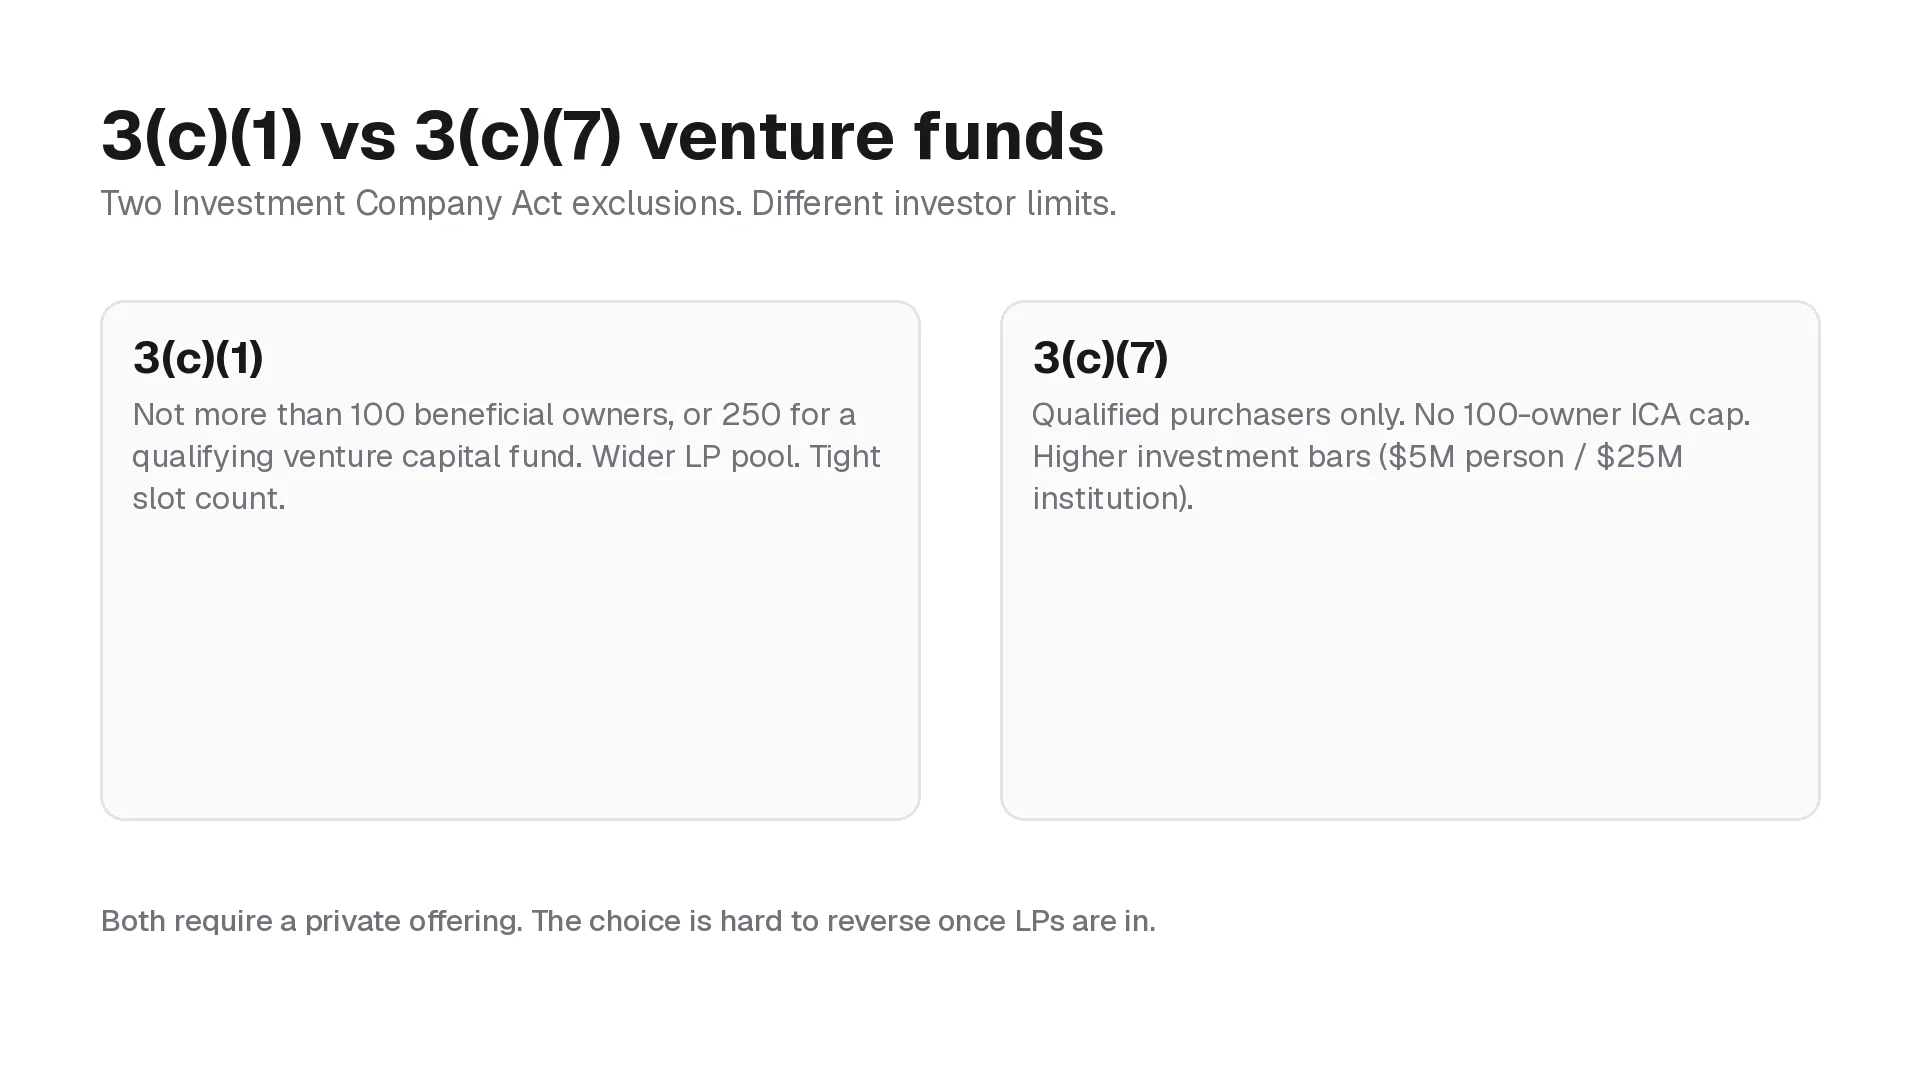
U.S. venture funds usually avoid Investment Company Act registration through 3(c)(1) or 3(c)(7). One caps how many people can own the fund. The other admits only qualified purchasers. Here is the difference, a worked slot example, and what it means for people who work at VC firms.
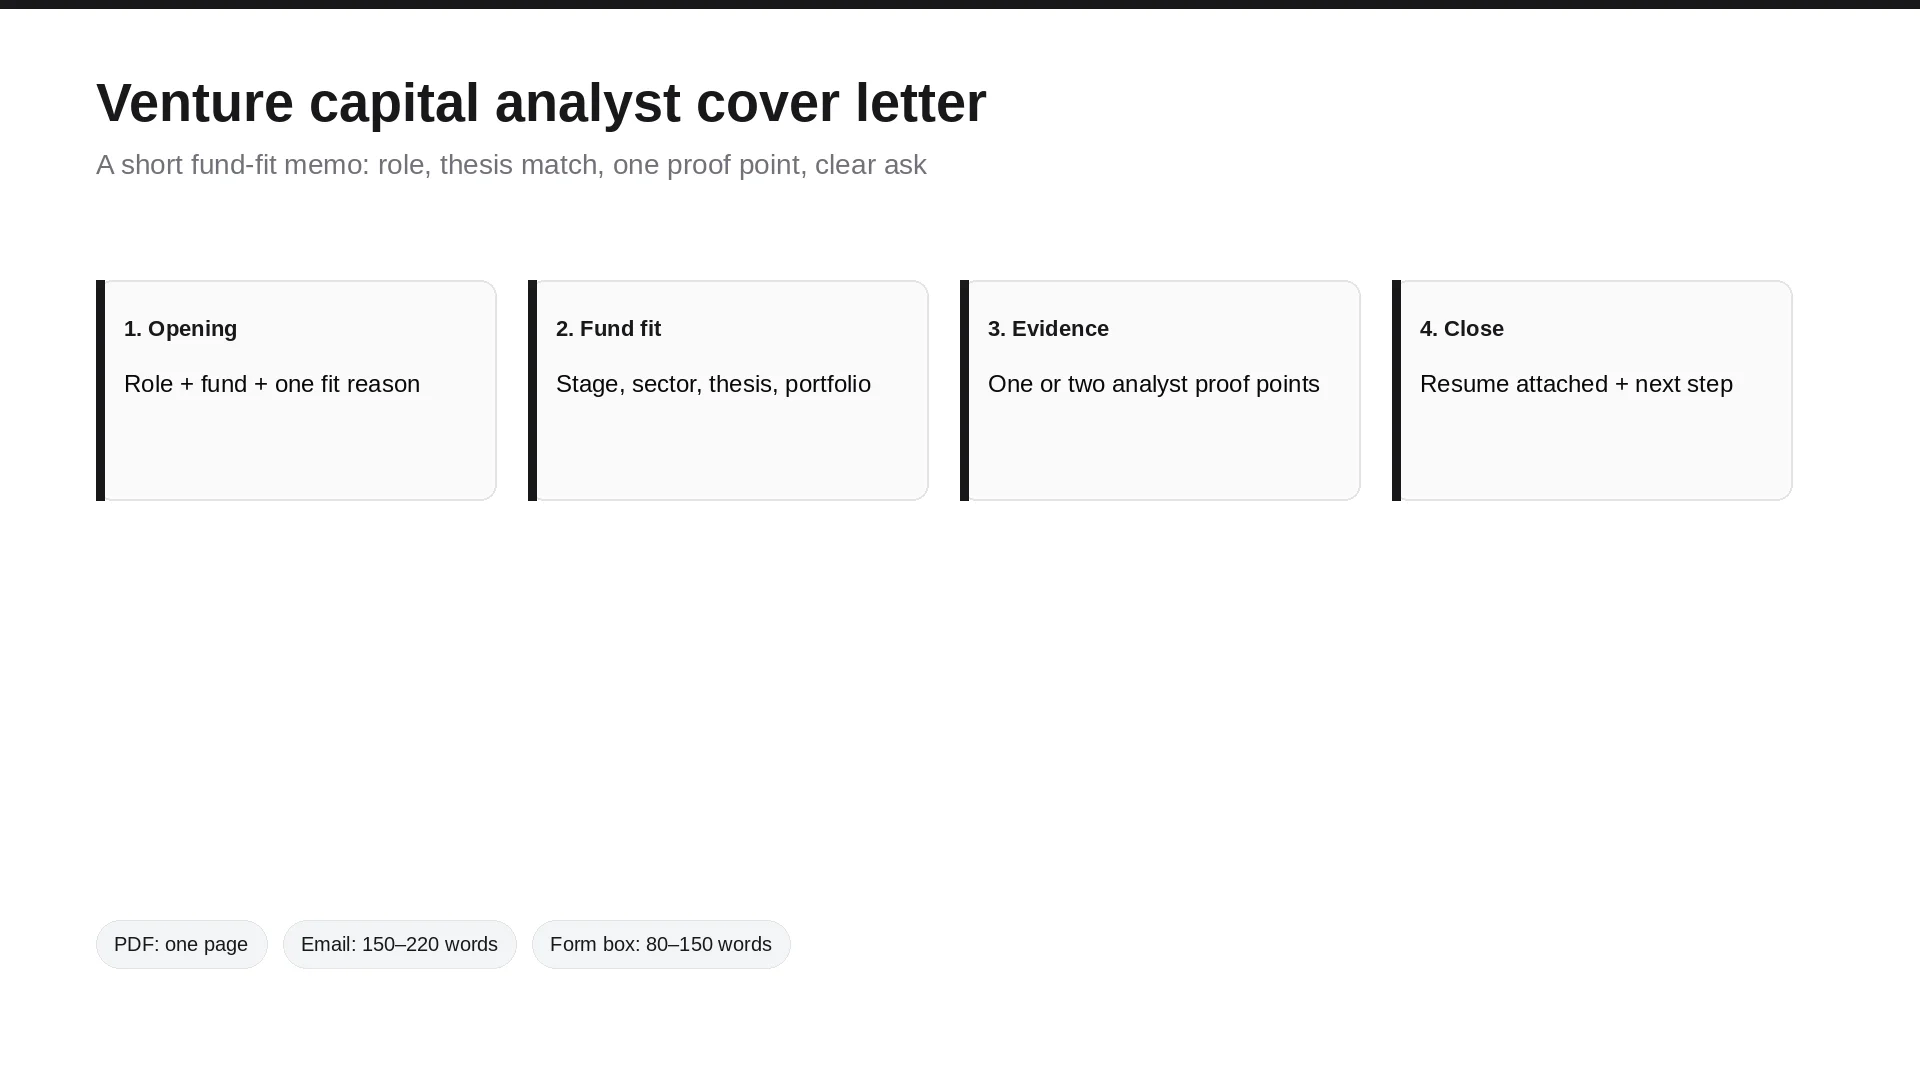
Write a concise VC analyst cover letter that ties your background to fund fit, sourcing, research, and investment analysis. Includes a template, sample letter, channel lengths, alternate application prompts, and checklist.