
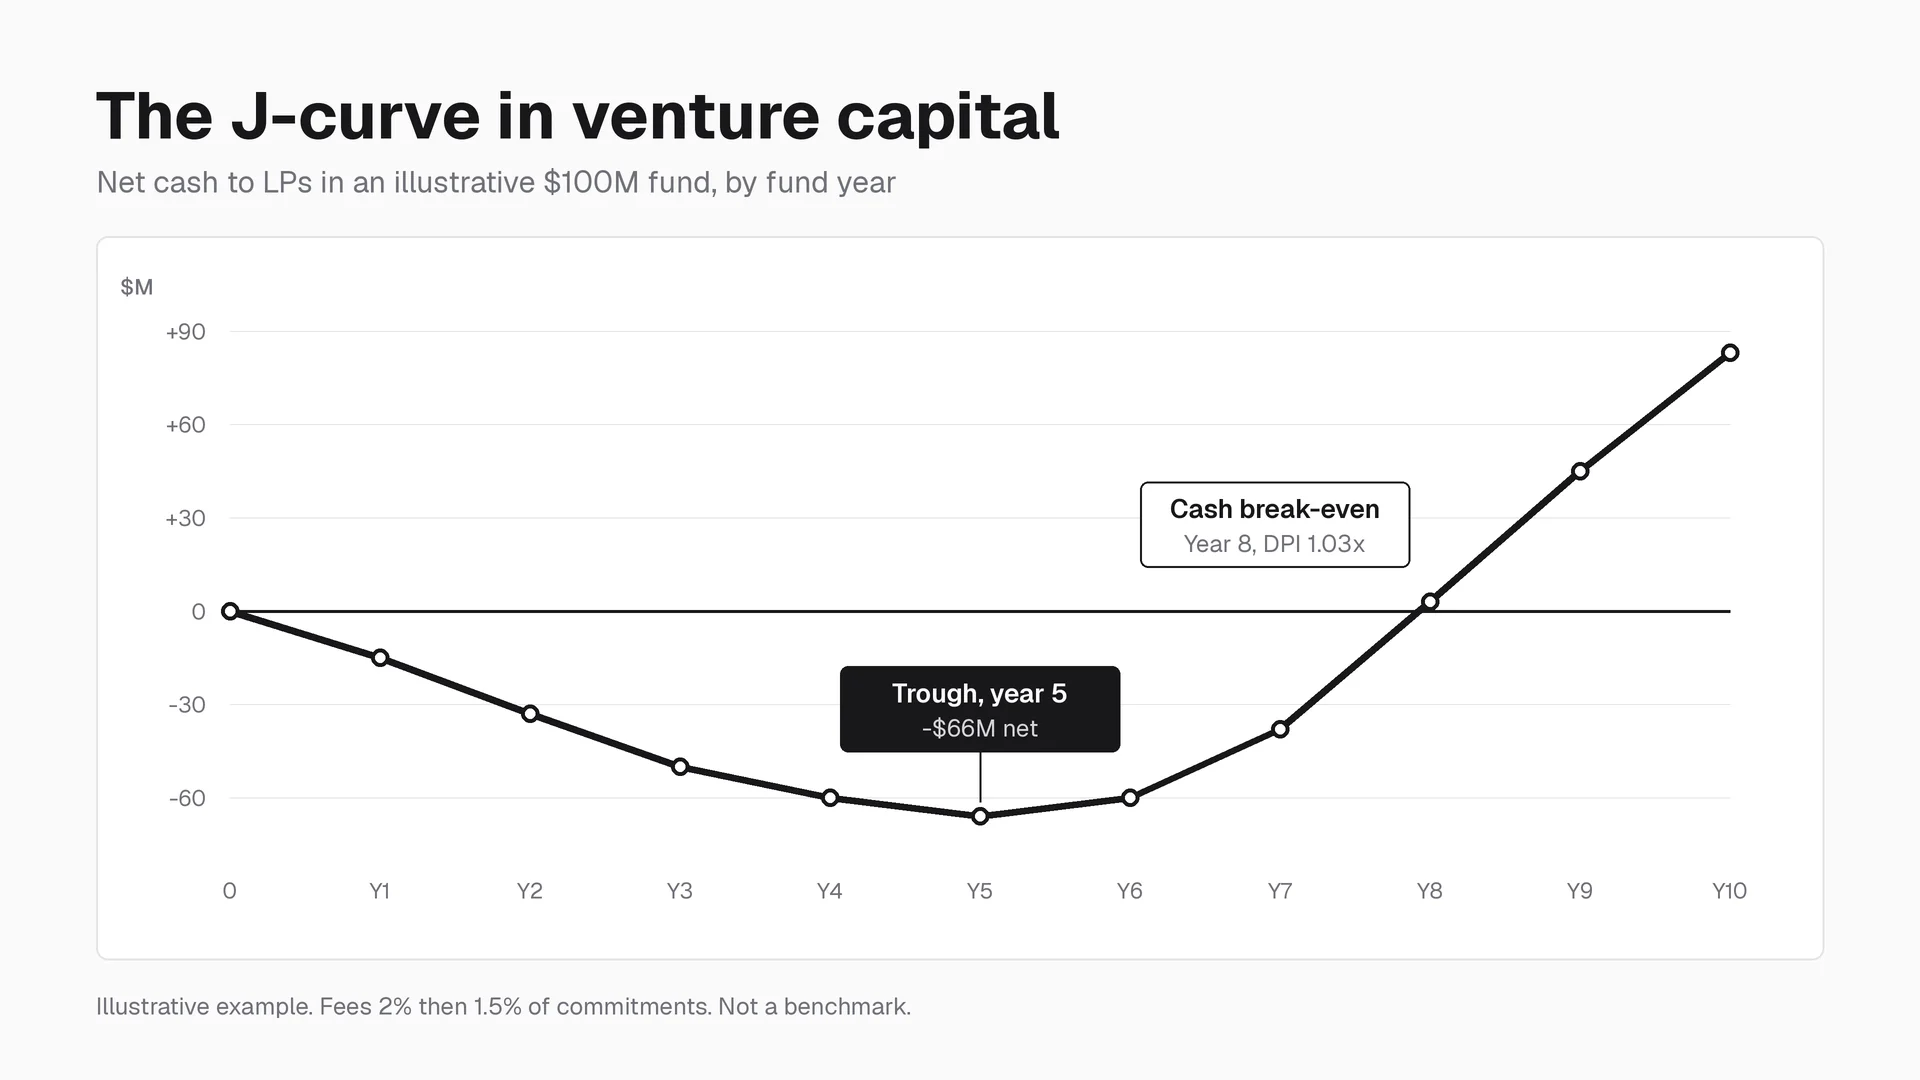
The J-curve in venture capital is the shape a fund's returns trace over its life. Returns go negative in the first years, because limited partners pay in capital and fees before any company exits, and then climb as winners are marked up and finally sold. Plotted against time, the line dips and then rises like the letter J. In venture the dip is deeper and longer than in most private-market strategies, and recent data shows the climb back is taking longer than the textbook version suggests.
If you work at a VC firm, or want to, the J-curve is not an LP abstraction. It decides when carry can pay, what a fund's track record looks like when you join, and how hard the next fundraise will be.
What the J-curve means in venture capital
A VC fund calls money from its limited partners over several years, invests it in young companies, and returns cash only when those companies are acquired or go public. Two things happen early. Cash flows one way, from LPs into the fund. And reported value lags, because new investments are held near cost while fees and early failures pull the total down.
That is why almost every chart of a young venture fund looks the same:
- Net cash to the LP falls for the first several years.
- Net IRR is negative or close to zero in the first two to four years.
- TVPI often sits below 1.0x early, then rises on markups.
- DPI stays near zero until exits begin.
The curve is a description of timing. It does not say whether the fund is good. A strong fund and a weak fund look alike in year two. They separate later, once the fund performance metrics that matter, DPI above all, have something to measure.
Why venture fund returns dip first
Fees start on day one
Management fees are usually charged on committed capital during the investment period, not on what has been invested. A $100 million fund charging 2% calls $2 million a year for fees before its portfolio has had time to grow. Legal, audit, and fund-formation costs land in the same early window.
New investments sit at cost
A seed or Series A check is typically held at its purchase price until a new priced round, a down round, or a write-off gives a reason to change it. So the money going out is fully counted, while the upside is not yet visible.
Losers show up before winners
Startups that fail tend to fail early. The old VC line is that lemons ripen early. Write-downs hit the fund in years two to four, while the companies that will eventually return the fund are still raising their Series B and C.
No cash comes back yet
Interim IRR counts every dollar paid in on the date it left the LP, but values unexited companies only at their current marks, which are still close to cost. With years of calls and no liquidity events, the math produces a negative IRR even when the portfolio is healthy.
The stages of the venture J-curve
Year ranges vary by fund size, stage, and market, but a ten-year venture fund usually moves through three stages.
| Stage | Typical fund years | What the metrics show | What the team is doing |
|---|---|---|---|
| Calls and fees | Years 1 to 3 | Negative net cash, negative or flat IRR, TVPI near or below 1.0x, DPI near zero | Sourcing, first checks, capital calls, building the portfolio |
| Marks and follow-ons | Years 4 to 7 | TVPI rises on new rounds, IRR turns positive, DPI still low | Follow-on decisions, board work, early exits, raising the next fund |
| Exits and distributions | Years 8 to 12+ | DPI climbs, TVPI and DPI converge, IRR settles | Exits, secondary sales, fund extensions, carry distributions once LPs are repaid |
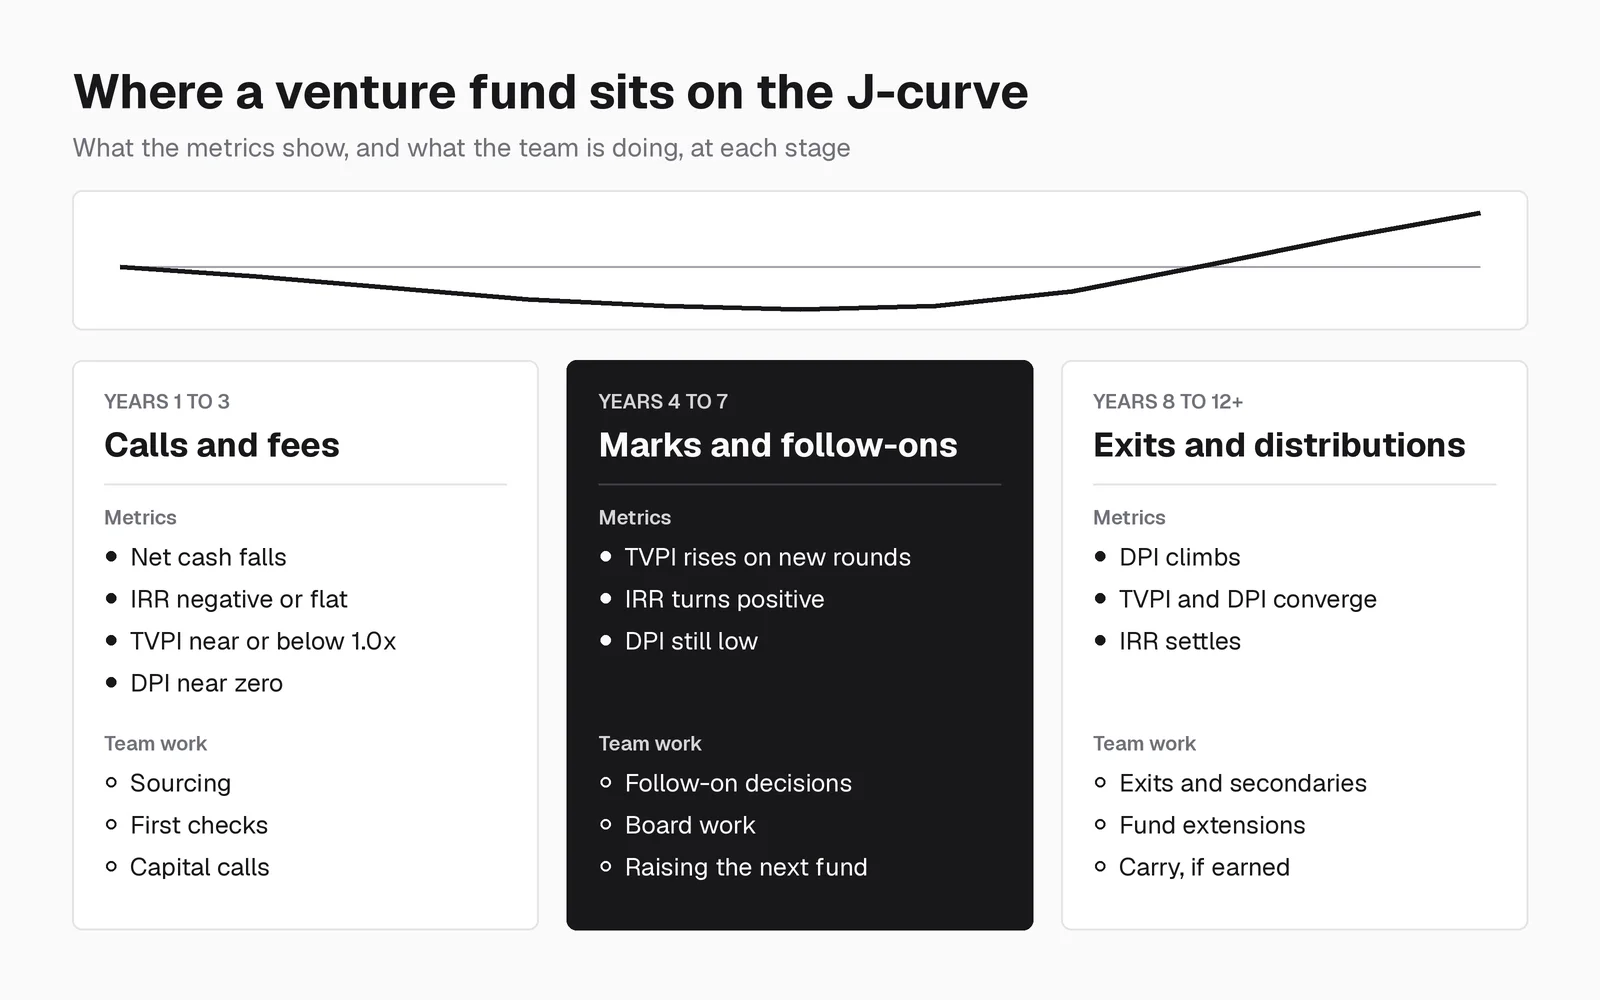
Each stage lines up with a phase of the fund lifecycle, from the investment period through realizations and wind-down.
A worked J-curve example
Here is an illustrative $100 million early-stage fund. It charges 2% of commitments in years 1 to 5 and 1.5% in years 6 to 10, invests most of its capital by year 5, and then has a handful of good exits. Figures are cumulative, in millions of dollars.
| Fund year | Capital called | Distributions | Net cash to LPs | DPI | What is happening |
|---|---|---|---|---|---|
| 1 | 15 | 0 | -15 | 0.00x | Fees plus first checks |
| 2 | 33 | 0 | -33 | 0.00x | Portfolio construction continues |
| 3 | 50 | 0 | -50 | 0.00x | First write-downs, first markups |
| 4 | 63 | 3 | -60 | 0.05x | Small acquisition, reserves deployed |
| 5 | 74 | 8 | -66 | 0.11x | Trough. Investment period ends |
| 6 | 82 | 22 | -60 | 0.27x | First meaningful exit |
| 7 | 88 | 50 | -38 | 0.57x | Two larger exits |
| 8 | 92 | 95 | +3 | 1.03x | Cash break-even for LPs |
| 9 | 95 | 140 | +45 | 1.47x | Fund-returning company sells stock |
| 10 | 97 | 180 | +83 | 1.86x | Tail positions remain |
Three things to take from it. The trough is deepest at the end of the investment period, not at the start. Break-even on cash takes eight years even in a fund that works. And most of the recovery comes from a few exits, which is the power law showing up in the timeline.
This example is a strong fund. As the next sections show, most recent vintages are well behind this path.
How IRR, TVPI, and DPI move along the curve
Each metric tells a different part of the J-curve story.
- IRR is sensitive to timing. In a young fund, one markup can swing it sharply because little time and cash sit behind it. It is the metric that dips the most.
- TVPI counts cash returned plus remaining paper value. It usually recovers first, because markups arrive before exits.
- DPI counts only cash returned. It is flat at zero for years and is the last metric to move.
The gap between them is the point. A fund in year five with 1.4x TVPI and 0.1x DPI has created value on paper and returned almost none of it. A fund in year ten with 2.0x TVPI and 1.6x DPI has turned most of its value into cash. When you read a fund's numbers, read them with its age.
What recent VC fund data shows
Carta publishes quarterly benchmarks from thousands of venture funds administered on its platform. About 89% of those funds manage less than $100 million, so treat the figures as a view of the broad market rather than of the largest firms. Three recent reports show the J-curve playing out in real vintages.
| Data point | Figure | Source |
|---|---|---|
| Median DPI, 2017 vintage | 0.37x | Carta, VC Fund Performance Q2 2026 |
| Median DPI, 2018 vintage | 0.15x | Carta, Q2 2026 |
| Median DPI, 2019 vintage | 0.04x | Carta, Q2 2026 |
| Top-decile net IRR, 2017 vintage | 25.7%, down from 28.7% two years earlier | Carta, Q2 2026 |
| Top-decile TVPI, 2017 vintage | 4.14x, up from 3.31x two years earlier | Carta, Q2 2026 |
| Share of 2017 and 2018 funds at 1x DPI or higher | Less than 20% | Carta, VC Fund Performance Q1 2026 |
| Median net IRR, 2021 and 2022 vintages | 1.4% and 0.7%, after climbing out of negative territory | Carta, Q4 2025 VC Fund Performance |
| Committed capital still held as dry powder, 2025 vintage | 72% | Carta, Q4 2025 |
Read together, the numbers make the J-curve concrete.
The bottom of the J is real and long. At the end of 2025, the median 2021 and 2022 funds had only just climbed out of negative IRR, roughly four and three years into their lives.
The right side of the J is flatter than the textbook curve. Funds raised in 2017 are approaching their tenth year, and the median one has returned 37 cents per dollar paid in. Most funds from 2017 and 2018 have not yet returned LPs' money in cash.
Value is being created, but on a longer clock. For the best 2017 funds, TVPI kept rising while IRR fell. That is what it looks like when gains are real but slow to turn into cash. The longer a gain takes, the less it adds to IRR.
How the J-curve differs by strategy
| Strategy | Depth of the dip | Time to recovery | Why |
|---|---|---|---|
| Pre-seed and seed VC | Deepest | Longest | Companies need several more rounds before they can exit |
| Multi-stage and growth VC | Moderate | Shorter | Later-stage companies are closer to exit, though marks track public markets |
| Buyout private equity | Shallower | Shorter | Mature companies, leverage, and dividend recaps return cash earlier |
| Secondaries funds | Shallow | Short | They buy into funds or shares that are already past the trough |
| Fund of funds | Layered and long | Longest tail | Each underlying fund has its own J-curve |
The curve is one reason the jobs differ. Growth equity and buyout teams see cash come back sooner, so exits and realized returns shape careers there earlier than they do in seed-stage venture.
Normal J-curve or weak fund?
"We're still in the J-curve" is true for every young fund, which makes it an easy line to hide behind. The explanation gets weaker as the fund ages. Use the fund's age to decide which questions apply.
- Years 1 to 3. Negative IRR and TVPI just below 1.0x are expected. Ask whether the fund is deploying on its stated pace and whether the first companies are hitting the milestones that justify their next round.
- Years 4 to 6. TVPI should be rising from new priced rounds, not from internal revaluations. Ask how much of the markup comes from one or two companies and whether those rounds were led by outside investors.
- Years 7 to 9. Some DPI should exist. Low DPI with high TVPI is a cash-return problem in waiting. Ask which companies can realistically exit in the next three years and at what size.
- Year 10 and later. The J-curve no longer explains weak cash returns. Ask about extensions, secondary sales, and what remains in the portfolio.
Comparing the fund with others from the same vintage matters more than comparing it with the textbook curve. A 2019 fund with near-zero DPI is in line with its peers. A 2014 fund with the same number is not.
How LPs and GPs manage the J-curve
The J-curve cannot be removed, but its effect can be spread out or shortened.
- Vintage pacing. LPs commit to new funds every year or two, so distributions from older funds help pay capital calls for newer ones.
- Secondaries. LPs can buy stakes in funds that are already past the trough, or sell their own stakes for liquidity. GPs can sell shares in mature companies to return cash earlier.
- Co-investments. Deals alongside the fund, often with lower or no fees, reduce the fee drag that deepens the dip.
- Subscription lines. Credit facilities let a fund invest first and call capital later. They delay the downward stroke and raise early IRR, but they do not change the multiple.
- Clear reporting. GPs who show LPs the expected curve before the first capital call have an easier time when year-two statements look negative.
Portfolio strategy choices, such as reserve ratios and deployment pace, also change the shape of the curve.
What the J-curve means if you work at a VC firm
Carry pays late
Carried interest is a share of profits, and under the common whole-fund structure the GP generally earns carry only after LPs have received their capital back. In the worked example, LPs reach cash break-even in year eight. In the Carta data, most 2017 and 2018 funds have not reached it. A carry allocation in a new fund is a claim on cash that may arrive a decade later, if at all. That is why carry is best valued as upside on top of cash pay, not as part of it.
Which fund you join matters
A new associate usually receives carry in the fund that is currently investing. If that fund is in year one, you are signing up for the full J-curve. If the firm is about to raise its next fund, your allocation may move to that one. Where the firm sits in its fund cycle shapes the economics as much as the percentage does.
The next fundraise happens in the trough
Many venture firms raise a new fund roughly three to four years after the last one, which is when the previous fund is at or near the bottom of its curve. LPs judge it on markups, the quality of the companies, and prior funds' DPI. Junior team members feel this directly. Portfolio updates, valuation support, LP meeting prep, and data rooms become part of the job. In fund operations and investor relations roles, managing the J-curve narrative is much of the work.
Questions to ask before you accept
- Which fund or funds does my carry come from, and what year is each fund in?
- How much of the current fund is invested, and how much is held in reserve?
- When does the firm expect to raise its next fund, and what role will I play?
- Have prior funds returned cash to LPs, or is performance mostly unrealized?
- Does carry vesting start on my start date or at the fund's first close?
Ask them after a verbal offer, as part of evaluating and negotiating the offer, not in a first-round interview.
How to explain the J-curve in a VC interview
The J-curve comes up in fund-economics questions, in modeling tests, and as a follow-up to "What do IRR, TVPI, and DPI measure?" in standard VC interview questions. A strong answer is short and mechanical.
"The J-curve is the pattern where a venture fund's returns go negative in the first few years and then rise. Early on, LPs pay in capital and fees, new investments are held near cost, and failures get written down before winners are marked up, so IRR is negative and DPI is zero. As companies raise up-rounds, TVPI recovers, and as they exit, distributions push DPI up. In venture it's deep and long because companies often take eight years or more to exit. Recent vintages show the right side is flatter than the textbook. The median 2017 fund has returned well under half its paid-in capital in cash."
Be ready for three follow-ups:
- Why is IRR misleading early? Because it annualizes a small number of cash flows. One markup or a subscription line can move it a lot.
- How would you tell a normal trough from a bad fund? Compare TVPI and DPI with funds of the same vintage, and check whether markups come from outside-led rounds.
- Why does this matter for a fund like ours? Tie it to the firm's stage. Seed funds have the longest curves, so reserve strategy and follow-on discipline matter more.
Frequently asked questions
How long does the J-curve last in venture capital?
Net IRR is usually negative for the first two to four years. Cash break-even for LPs, a DPI of 1.0x, takes much longer. In Carta's Q1 2026 data, fewer than 20% of funds from the 2017 and 2018 vintages had reached 1x DPI, which means most venture funds take more than eight to nine years to return paid-in capital.
Is a J-curve a bad sign?
No. Almost every closed-end venture fund has one. It becomes a warning sign when a mature fund, seven or more years old, still has little DPI and relies on paper markups to explain its performance.
Can a VC fund avoid the J-curve?
Not fully. Subscription lines, secondary sales, co-investments, and later-stage strategies can make the dip shallower or shorter. A fund that invests in young companies and waits for exits will always show early negative returns.
How is the J-curve different from the power law?
The power law describes how returns are distributed across companies, with a few winners producing most of the gains. The J-curve describes when those returns show up over the fund's life. They are connected, because the fund-returning winners are often the last companies to exit, which is why the right side of the J takes so long.
What is a reverse J-curve?
A reverse J-curve is the opposite pattern. Returns look strong early and then fall. In venture it can happen when a fund marks companies up aggressively on hot rounds and later writes them down, as many funds did when startup valuations reset in 2022.
Does a subscription line change the J-curve?
It changes the timing, not the outcome. Borrowing against LP commitments lets the fund invest before calling capital, so LP cash goes out later and early IRR looks better. The total multiple LPs receive is the same or slightly lower once interest is paid.
Next steps
If you are interviewing at venture firms, ask where each fund sits on its J-curve and read the answer against the fund's age. You can browse open VC jobs, research firms before you apply in the venture capital companies directory, and create a free account to get new roles by email.
Related posts
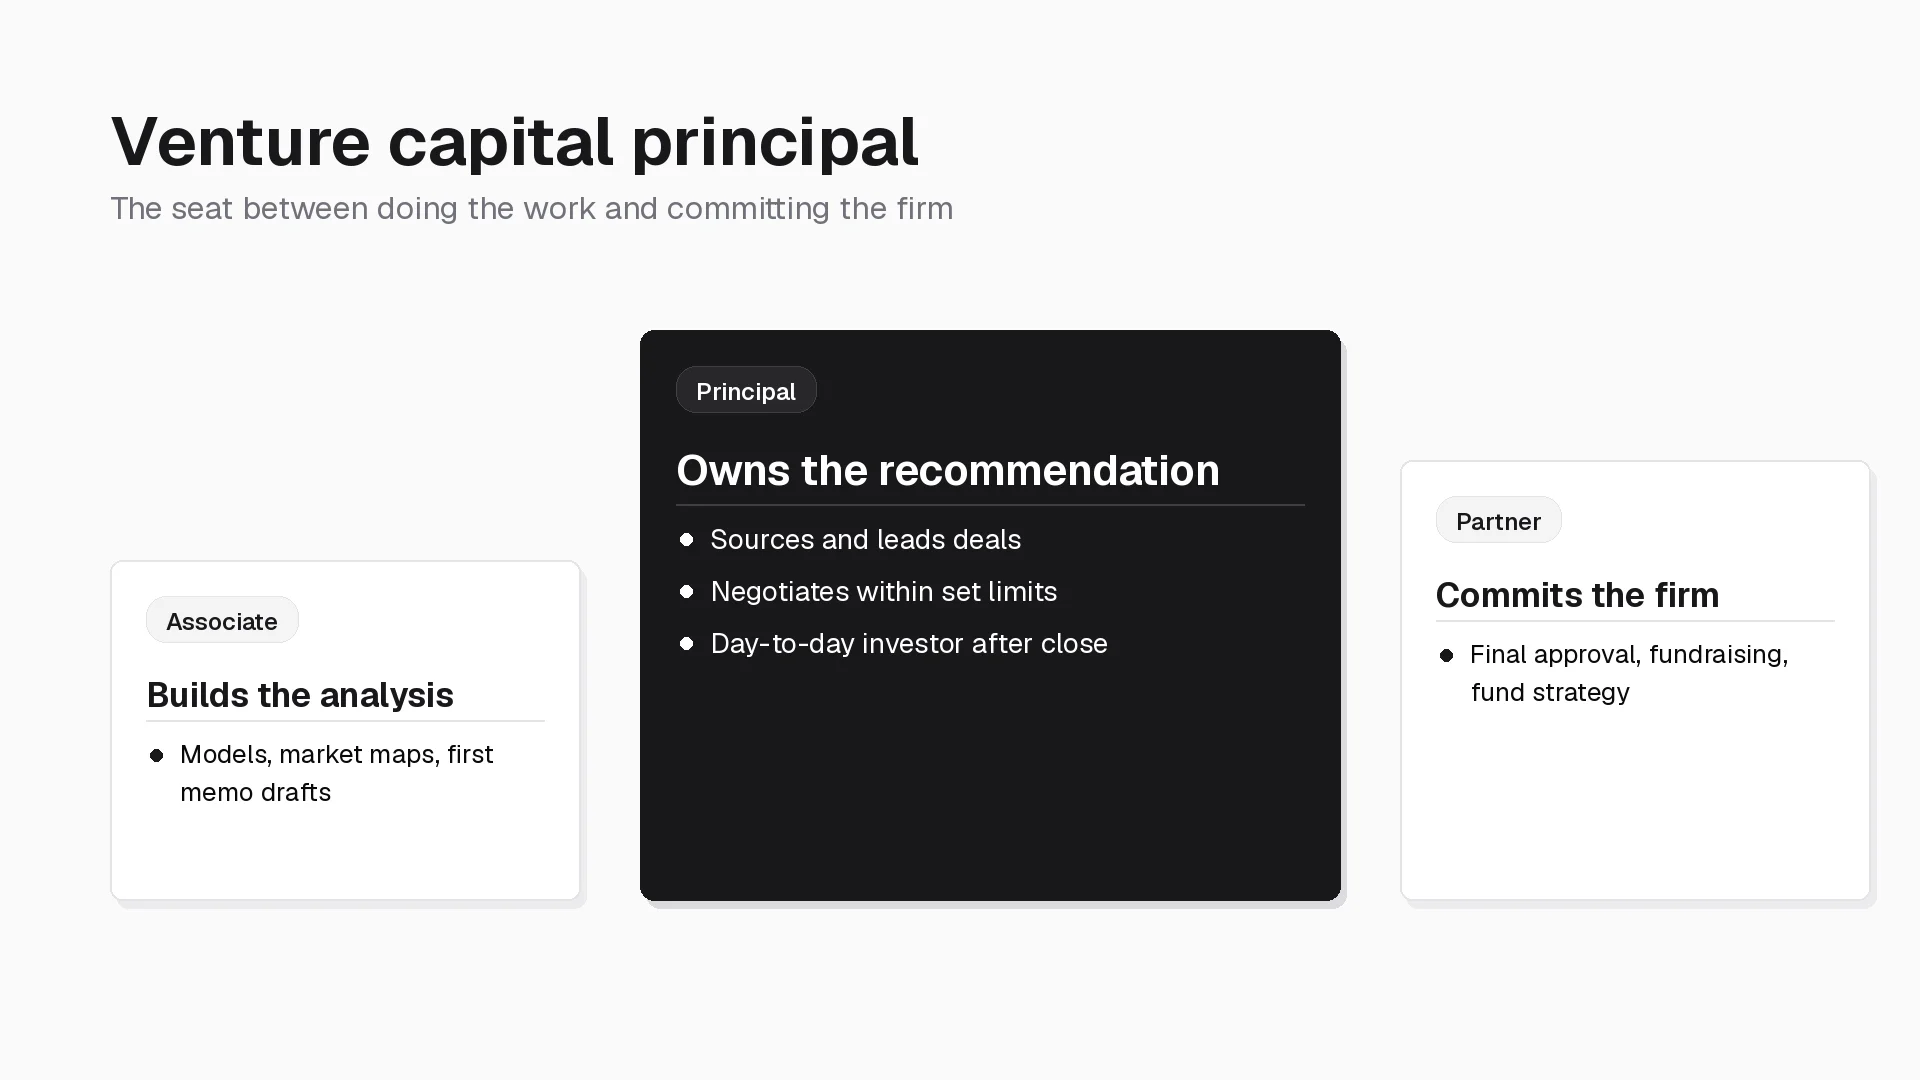
What a venture capital principal does, how the role differs from associate and partner, how to read a principal posting and value its carry, plus a copy-ready job description template and hiring scorecard.
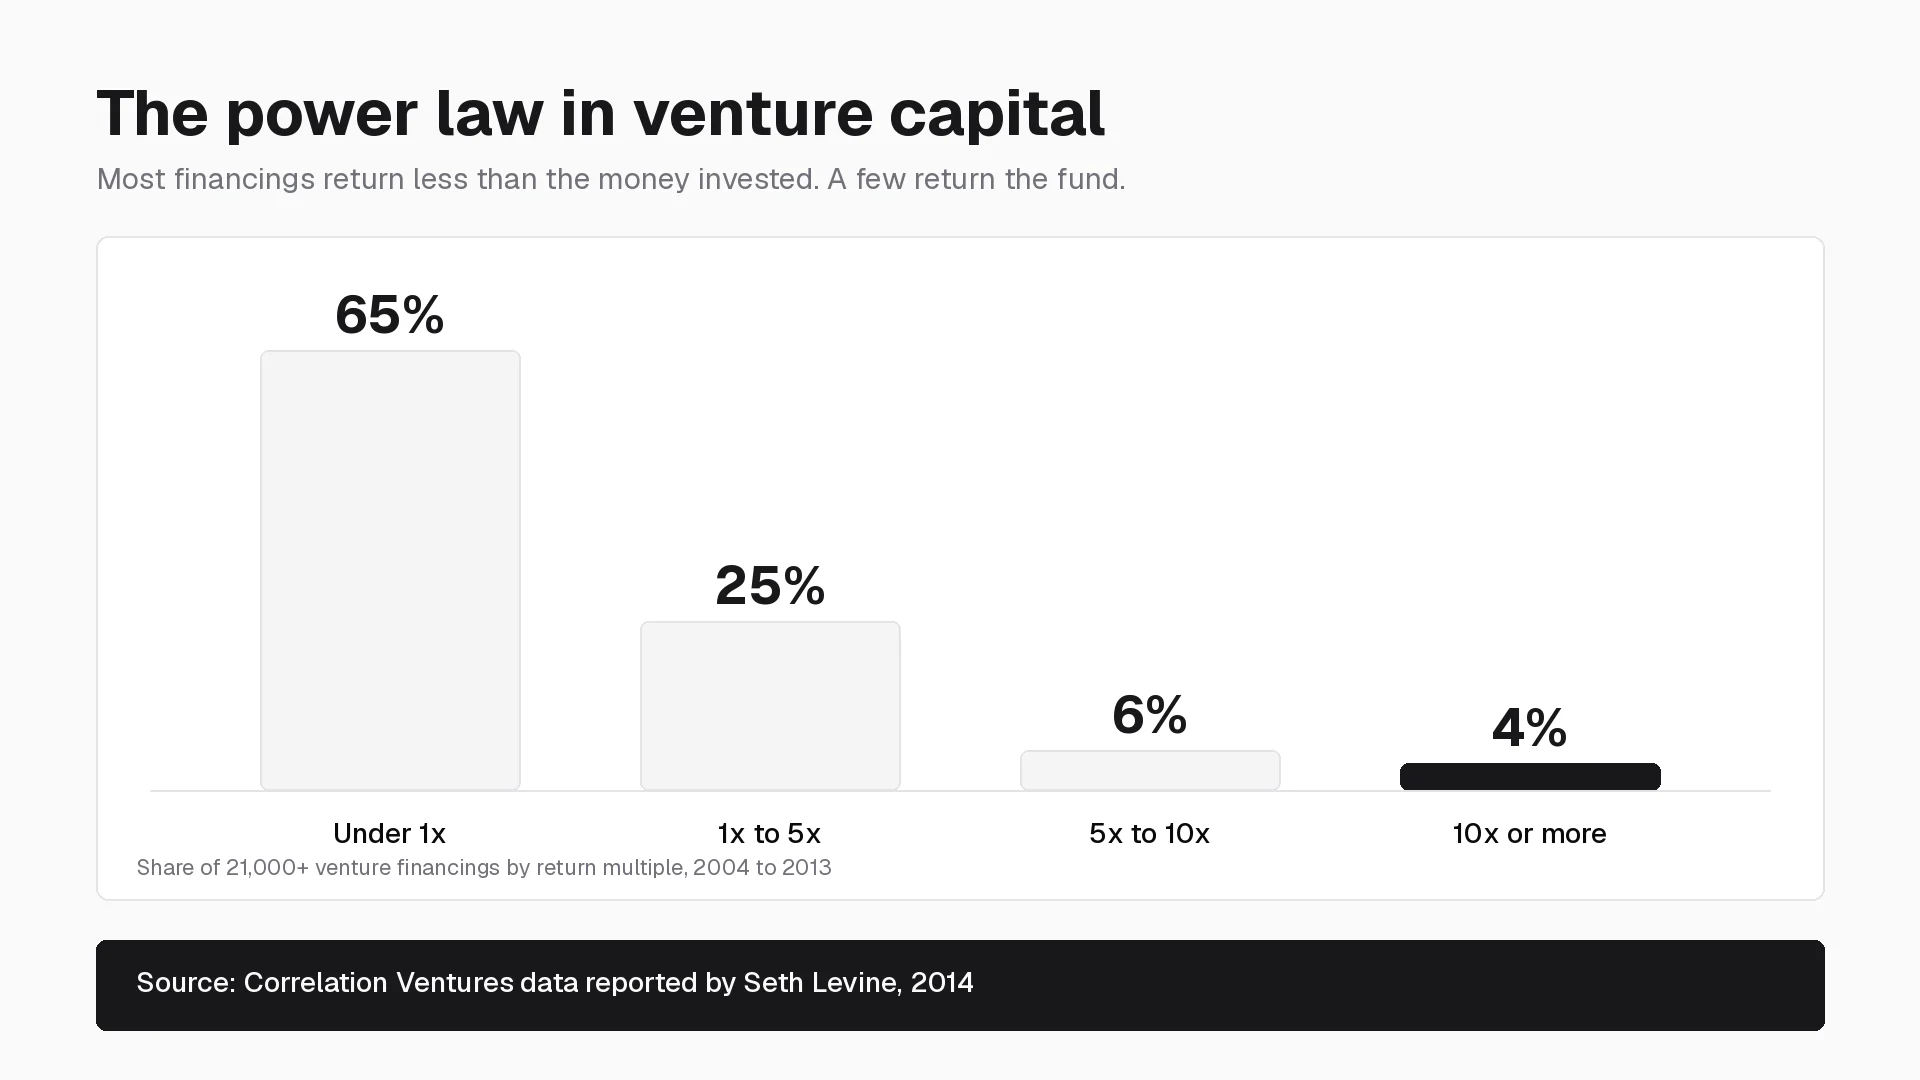
The power law in venture capital explained with primary data, a fund-returner grid by fund size and ownership, and what it changes in VC sourcing, screening, carry, and interviews.
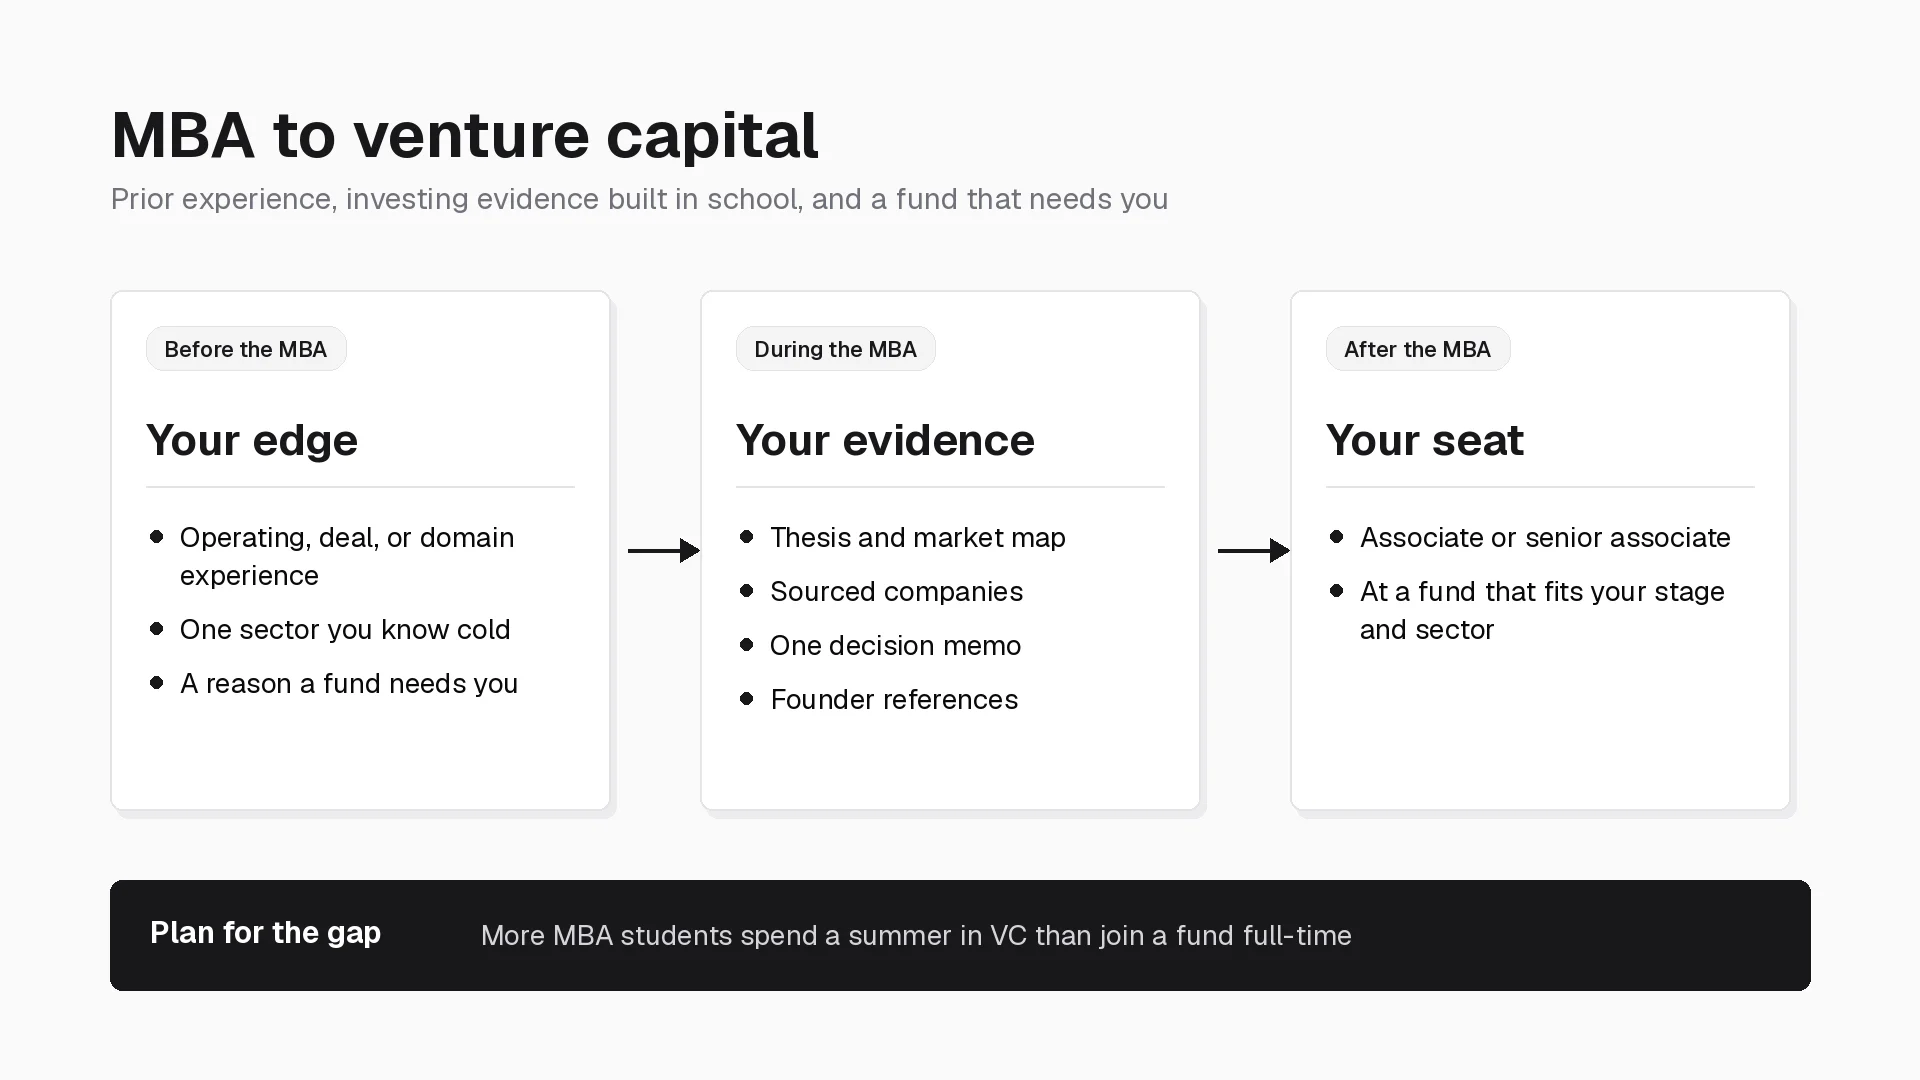
How to move from an MBA to venture capital: what employment reports show about VC placement, how to judge a program, why summer VC internships outnumber full-time offers, and a two-year recruiting plan.