
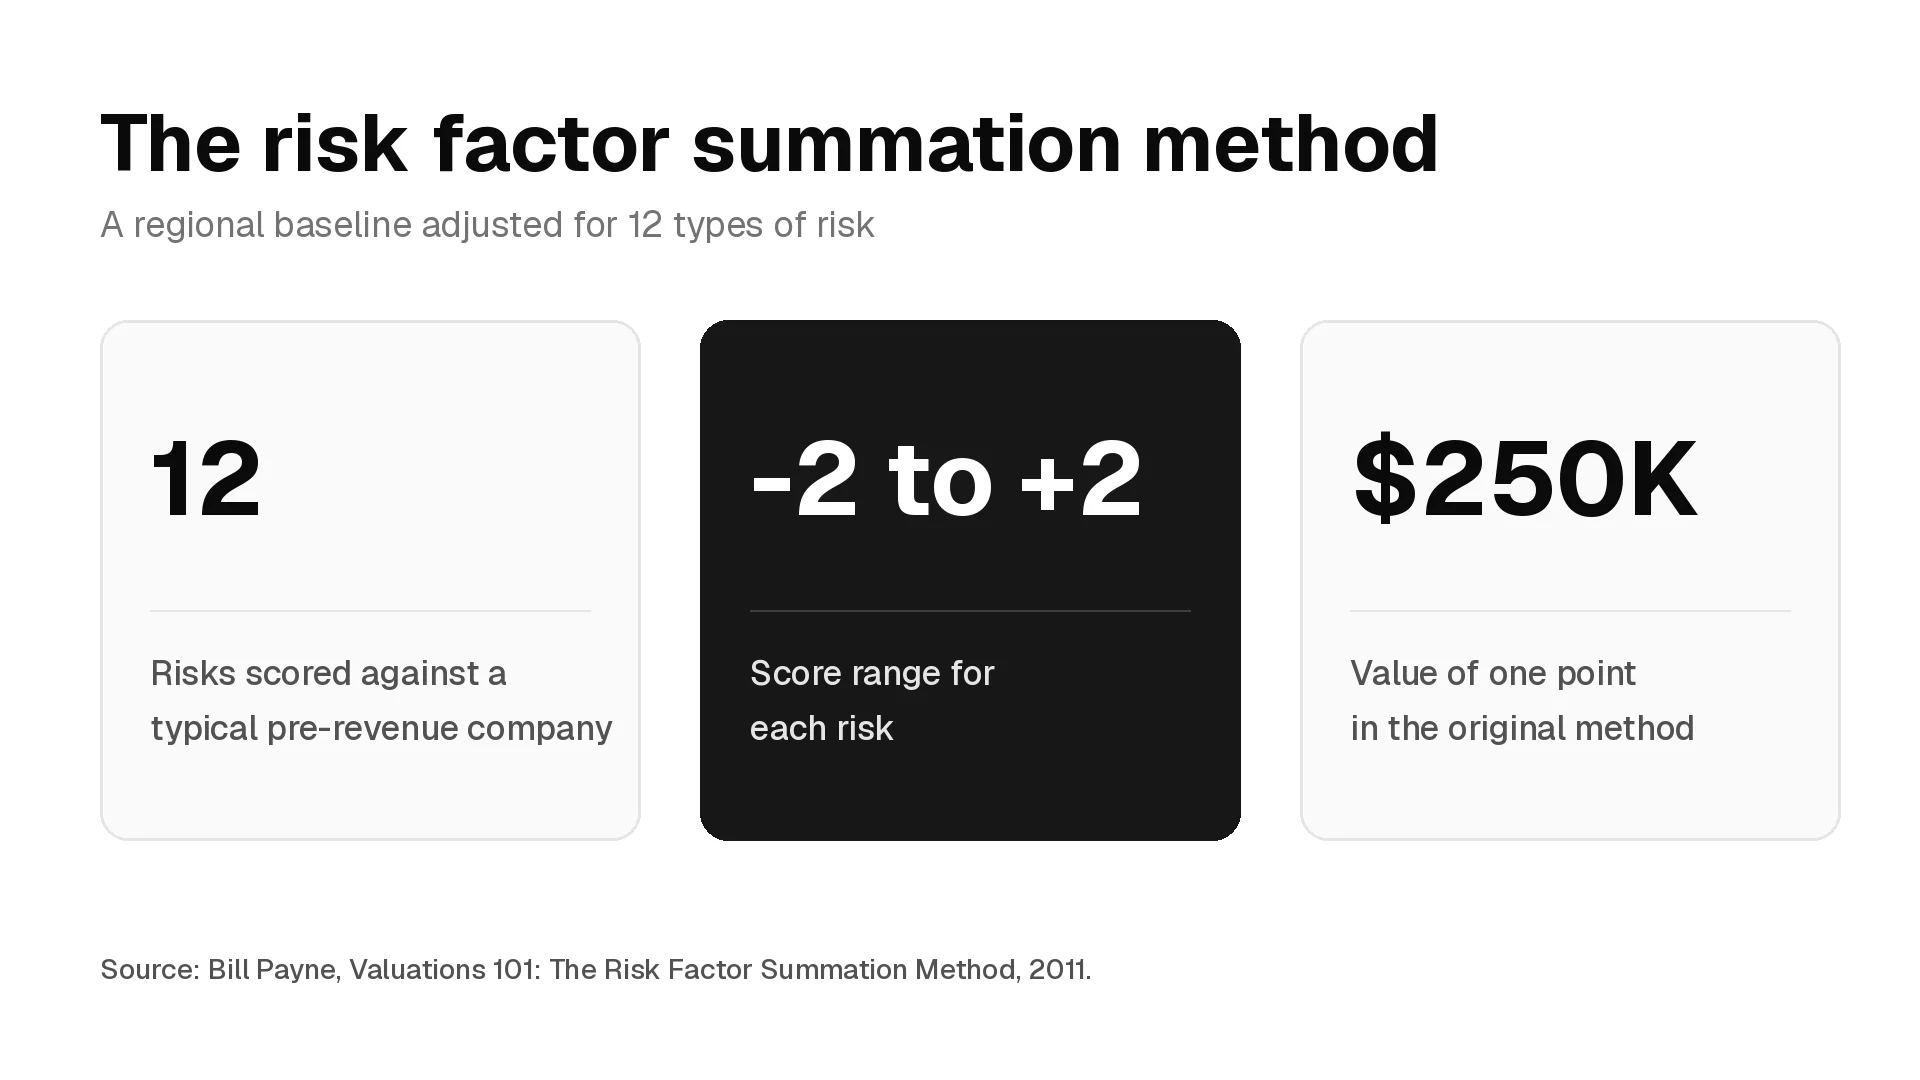
The risk factor summation method values a pre-revenue startup by taking the average pre-money valuation of similar companies in its region and adjusting it for 12 types of risk. Each risk gets a score from -2 to +2, and each point moves the valuation by $250,000, so a net score of +2 adds $500,000. Angel investor Bill Payne described the method in 2011, credited it to the Ohio TechAngels angel group, and recommended it as one of several methods rather than a price on its own.
This guide is for analysts and associates at angel groups, pre-seed funds and seed funds, and for candidates who expect a valuation question in a VC interview. It covers the 12 risks, how to score them with evidence, where the baseline comes from, a worked example with ownership and return checks, how the $250,000 step compares with current seed prices, and how the method fits into diligence, memos and interviews.
What the risk factor summation method is
The risk factor summation method is a pre-money valuation method for companies with no revenue to value. Bill Payne laid it out in a November 2011 post, the fifth in his series on valuing pre-revenue companies. He noted that the scorecard and Berkus methods each "considered a narrow set of important criteria", while this one "considers a much broader set of factors."
Payne quotes the Ohio TechAngels on its purpose. The method "forces investors to think about the various types of risks which a particular venture must manage in order to achieve a lucrative exit." The same text adds that "the largest is always 'Management Risk'", but that the method "prompts the user to assess other risk types" as well.
Payne was clear about its limits. In his words, the method "may be less useful as a stand-alone valuation method for investors", yet it should be one of several methods early-stage investors use "because it forces investors to consider important exogenous factors." Regulation, manufacturing, litigation, international exposure and reputation rarely show up in a valuation that only looks at the team, the product and the market.
The result is a pre-money valuation, the value of the company before the new money comes in.
How the risk factor summation method works
The calculation has four steps:
- Set the baseline. Find the average pre-money valuation of pre-revenue companies in the same region, and ideally the same sector and stage.
- Score the 12 risks. Give each one a score from -2 to +2 against a typical company in that baseline.
- Add the scores. The 12 scores net to a single number between -24 and +24.
- Convert to dollars. Multiply the net score by $250,000 and add the result to the baseline.
Payne's scale reads as follows:
| Score | Meaning in Payne's 2011 post | Dollar effect |
|---|---|---|
| +2 | Very positive for growing the company and executing a wonderful exit | +$500,000 |
| +1 | Positive | +$250,000 |
| 0 | Neutral | $0 |
| -1 | Negative for growing the company and executing a wonderful exit | -$250,000 |
| -2 | Very negative | -$500,000 |
Pre-money valuation = baseline + (net score x $250,000)
Net score range: -24 to +24
Largest possible adjustment: -$6.0 million to +$6.0 million
Payne's own example starts from a $2.0 million regional average. Five risks score 0, five score +1, one scores -1 and one scores -2, which nets to +2. Adding $500,000 gives a $2.5 million pre-money valuation.
The 12 scores are judgments, and the method gives no rule for turning evidence into a score. The next section sets one out.
The 12 risk factors and how to score them
Payne lists the 12 risks in this order. The evidence columns are a working guide for an analyst, not part of his text. Score each risk against a typical company in the baseline, not against a perfect company, so a 0 means "about what you would expect at this stage."
| Risk | Evidence for a positive score | Evidence for a negative score |
|---|---|---|
| Management | Founders who have built or sold in this market, key technical and commercial roles filled, full-time | Solo or part-time founders, missing a core skill, no relevant track record |
| Stage of the business | Working product with users or a passed technical milestone | Idea, slides or a prototype only the founder can run |
| Legislation or political | Clear rules, or regulation that favors the product | Needs approval or a license it does not have, or depends on a rule that could change |
| Manufacturing | Software, or a proven contract manufacturer with a second source | Custom hardware, one supplier, untested production at volume |
| Sales and marketing | Named buyers, signed pilots, a short and repeatable sales path | No sales lead, long enterprise cycles, unclear buyer |
| Funding or capital raising | Can reach the next milestone on this round, investors likely to follow on | Needs several large rounds before revenue |
| Competition | Clear edge over incumbents and other startups | Crowded market, well-funded rivals, easy to copy |
| Technology | Core technology works, protected by patents or know-how | Unproven science or a key technical risk not yet retired |
| Litigation | Clean IP ownership, no claims, standard contracts | IP owned by a former employer or university, open disputes, liability exposure |
| International | Home market large enough, or overseas exposure well managed | Relies on foreign suppliers, currencies or markets it cannot control |
| Reputation | Strong references from customers and past colleagues | Past disputes, poor references, a product that invites public criticism |
| Potential lucrative exit | Active acquirers and recent exits in the sector | Few buyers, small exits, or no clear path to one |
A few rules keep the scores defensible:
- Tie every non-zero score to something someone else could check, such as a signed letter, a reference call or a patent filing.
- Don't score an unknown as 0. A risk you have not looked at yet is an open diligence item. List it, and score it once you have the answer.
- Watch for overlap inside the list. Stage and funding risk often move together, and the exit score rewards strengths already counted under management, sales and competition. If one fact drives three scores, count it once.
- Have two people score independently before comparing. Gaps of two points or more on the same risk usually mean the evidence is thin.
Where the baseline comes from
The baseline sets the size of the answer, and the 12 scores only move it. Payne's instruction is to use "the average pre-money valuation of pre-revenue companies in your region", and he points readers to the scorecard method for how to find it.
Good sources for that average, in rough order of quality:
- Your own firm's or angel group's recent pre-revenue deals in the same region and sector.
- Priced pre-revenue rounds you can confirm with co-investors in the same market.
- Published medians from a data provider, filtered as closely as possible to pre-revenue companies in your region.
Two choices make the result less useful. One is using a scorecard result as the baseline. The scorecard has already adjusted for team, product and market, so scoring those risks again counts them twice. The other is using a broad national seed median. PitchBook tags a round as seed when investors or the press release call it that, so the median includes companies with revenue and well-known founders.
Risk factor summation example
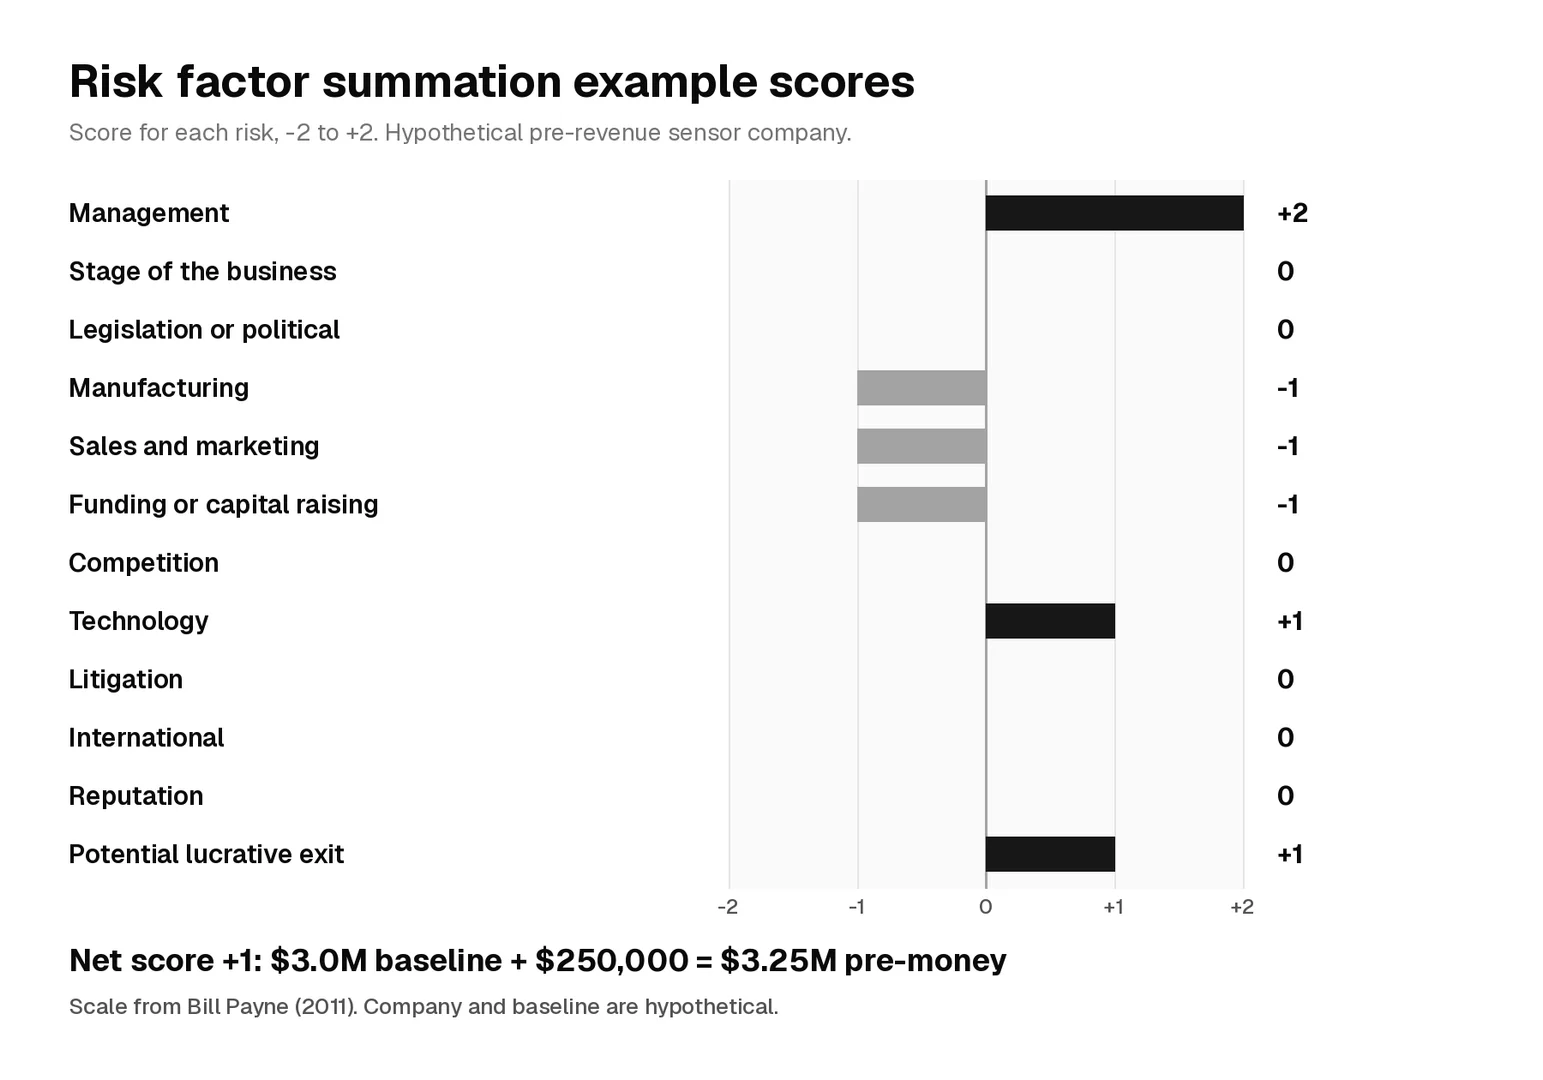
The company below is hypothetical. It is a pre-revenue maker of vibration sensors that predict machine failures in factories, raising $750,000 from an angel group. The analyst uses $3.0 million as the average pre-money valuation of pre-revenue hardware companies in the region, based on the group's own recent deals.
| Risk | Evidence | Score |
|---|---|---|
| Management | Founders ran product and engineering at an industrial automation company; both full-time | +2 |
| Stage of the business | Working units in pilots at two plants, typical for the baseline | 0 |
| Legislation or political | No license needed to sell | 0 |
| Manufacturing | One contract manufacturer, no second source qualified | -1 |
| Sales and marketing | Plant buyers take 9 to 12 months to sign, no sales lead hired | -1 |
| Funding or capital raising | Needs a larger round to build inventory before revenue | -1 |
| Competition | Several sensor vendors, but none with this failure model | 0 |
| Technology | Model flagged failures in both pilots; patent application filed | +1 |
| Litigation | IP assigned to the company, no claims | 0 |
| International | Sensors built domestically, home market large enough | 0 |
| Reputation | Strong references from both pilot plants | 0 |
| Potential lucrative exit | Industrial automation companies buy sensor startups | +1 |
| Net score | +1 |
With the $250,000 step, the pre-money valuation is $3.0 million plus $250,000, or $3.25 million.
Now the checks an investor would run on that number:
- Post-money and ownership. A $750,000 raise on a $3.25 million pre-money gives a post-money valuation of $4.0 million, so the new investors own 18.75%.
- The 10x check. A 10x return on $750,000 is $7.5 million. At 18.75% with no later dilution, the company has to exit for $40 million. If later rounds cut the stake in half, to about 9.4%, it has to exit for $80 million.
- What moves the answer. One point is worth $250,000. If the second supplier falls through and manufacturing drops to -2, the value is $3.0 million. If a pilot converts to a paid order and sales moves to 0, it is $3.5 million. Changing the baseline by $500,000 moves the answer as much as two full points.
Is a $250,000 step still right?
On Payne's $2.0 million example baseline, one point was 12.5% of the value. Seed prices have moved a long way since 2011. The PitchBook-NVCA Venture Monitor for Q3 2026 puts the median US seed pre-money valuation at $16.0 million in 2025 and $18.3 million in 2026 through September 30.
| Baseline | One $250,000 point as a share | Largest possible swing (+/-$6.0M) as a share |
|---|---|---|
| $2.0M (Payne's 2011 example) | 12.5% | 300% |
| $3.0M (hypothetical example above) | 8.3% | 200% |
| $16.0M (US seed median, 2025) | 1.6% | 38% |
| $18.3M (US seed median, 2026 YTD) | 1.4% | 33% |
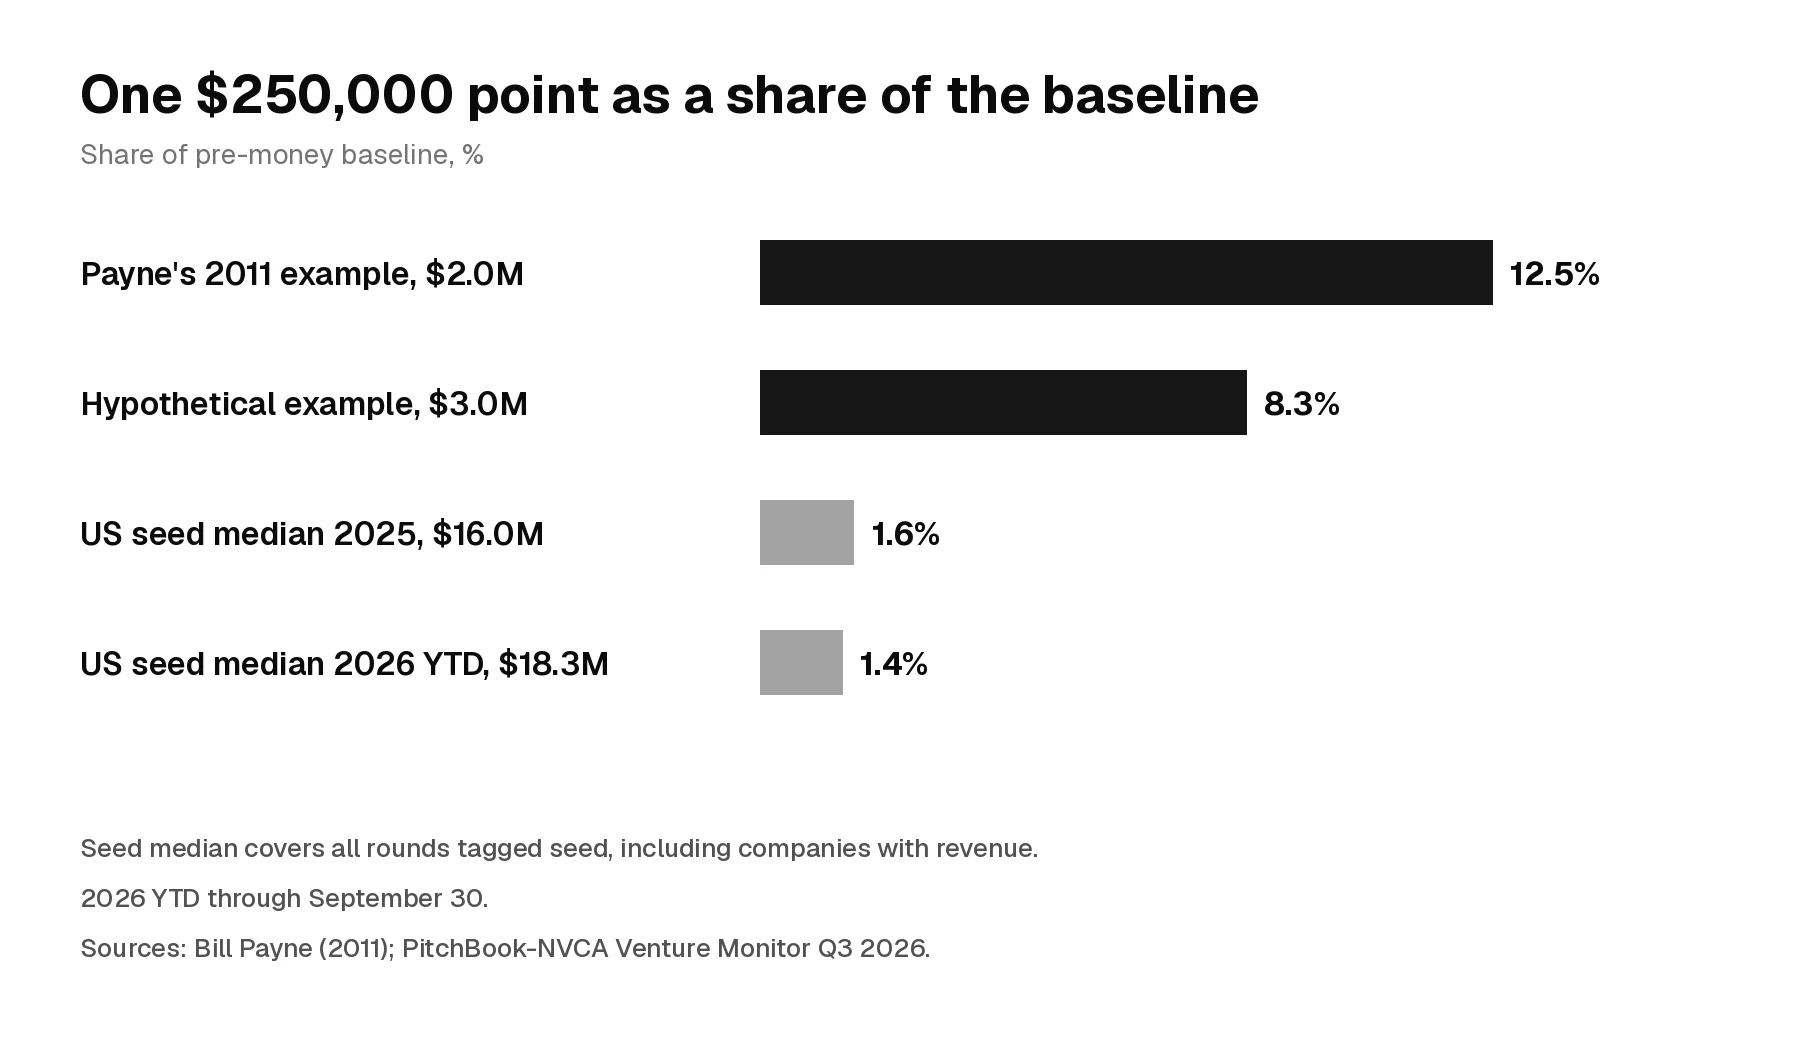
The broad seed median is not a pre-revenue baseline, for the reason given above. The table only shows the scale problem. On a large baseline, a fixed $250,000 step makes the 12 scores almost irrelevant. On a small one, a run of negative scores can push the result below zero. On Payne's $2.0 million baseline, a net score of -8 gives exactly zero.
Two ways to handle this:
- Keep the $250,000 step for small angel and pre-seed checks, where baselines are close to Payne's.
- Set the step as a share of the baseline. Keeping Payne's 12.5% ratio on the $3.0 million example gives a $375,000 step and a $3.375 million valuation.
Either way, state the step in the memo. A reader who does not know whether a point was worth $250,000 or $2 million cannot judge the result. If the scores net to -6 or lower, treat that as a sign the company does not fit the baseline, and lean on other methods.
When not to use the risk factor summation method
- Companies with revenue. Payne described the method for pre-revenue companies. Once revenue exists, value the company on revenue and comparable deals.
- No usable baseline. Without a credible regional average for similar pre-revenue companies, the 12 scores have nothing to adjust.
- As the only method. Payne's own advice is to use several methods and treat this one as a check on risks the others miss.
Common mistakes
- Adding or averaging it with a scorecard result. Both start from the same kind of baseline and both score team, stage, sales, competition and technology, so the two results are not independent views.
- Scoring against a perfect company. A typical company in the baseline scores 0 on most risks. Scoring every gap as a negative drags the result below the market.
- Treating unknowns as neutral. A 0 should mean you checked and found the company typical.
- Counting one fact three times. A thin team can show up under management, stage and funding. Pick the risk it belongs to.
- Hiding the step. Using $250,000 on a $15 million baseline, or a scaled step without saying so, makes the result impossible to check.
- Reading the output as a precise price. The sum is a starting point for negotiation and a list of risks to diligence.
Risk factor summation vs Berkus, scorecard and the VC method
| Method | Starting point | How it adjusts | Best fit |
|---|---|---|---|
| Risk factor summation | Average pre-money of similar pre-revenue companies | Adds or subtracts a fixed step for each point across 12 risks | A risk-focused cross-check on another method |
| Berkus | No market baseline | Adds up to $500,000 for each of five milestones | Pre-revenue companies judged on milestones |
| Scorecard | Median pre-money of comparable recent deals | Multiplies the baseline by weighted scores against a typical deal | Pre-revenue companies with good regional comparables |
| VC method | Expected exit value | Works back from the exit at a target return, adjusted for dilution | Companies where an exit value can be estimated |
| First Chicago method | Several outcome scenarios | Weights each scenario's value by its probability | Companies with very different possible outcomes |
The Berkus method and the scorecard method look at a short list of strengths. Risk factor summation adds the outside risks they skip: legislation, manufacturing, litigation, international and reputation. The VC method tests whether the price works for the fund's return, and the First Chicago method handles companies whose outcomes could split widely.
How VC analysts use the risk factor summation method
At angel groups, pre-seed funds and seed funds, the method is more useful as a risk checklist with a price attached than as a pricing tool. Analysts tend to use it in four places.
- Screening a SAFE cap. Many pre-revenue rounds are raised on a SAFE or a convertible note with a valuation cap. A quick score against a local baseline shows whether the cap a founder asks for is in range for the risks still open.
- Planning diligence. The 12 risks map to due diligence work. Management needs reference calls and a founder-market fit read. Sales needs customer calls. Technology needs a technical review. Litigation and legislation need a look at IP assignments and any licenses. Manufacturing and international need supplier checks. Any risk you can't score yet goes on the diligence list.
- Writing the memo. In an investment memo, the 12-row table with an evidence column doubles as the risks section. Show the baseline and its source, the step, the post-money and ownership, and the 10x check, then compare with a Berkus or VC method result and explain any gap.
- Preparing for the committee. At the investment committee, expect questions about the risk that could sink the deal. The -2 and -1 rows answer that before the question comes, and they show what the company must fix before the next round to earn a higher price.
How to answer a risk factor summation question in a VC interview
Valuation questions come up in VC case study interviews and in technical rounds of VC interview questions. A strong answer gives the mechanics, the judgment and the limits in under a minute:
"Risk factor summation starts from the average pre-money valuation of similar pre-revenue companies in the region, then scores 12 risks from -2 to +2, including management, stage, regulation, manufacturing, sales, funding, competition, technology, litigation, international, reputation and exit potential. Each point is worth $250,000 in the original version, so a net +2 adds $500,000. I'd scale that step to the baseline, because $250,000 means little on a seed round priced in the teens of millions. I'd use it as a cross-check, not the price, and I wouldn't average it with a scorecard because they score the same things. Its value is that it makes me look at outside risks like regulation, suppliers and litigation."
If the interviewer gives you a company, name the baseline and the step first, score the risks that matter out loud with the evidence behind each, then run post-money, ownership and the 10x check.
FAQ
Is the risk factor summation method pre-money or post-money?
Pre-money. The baseline is an average pre-money valuation, and the adjustment keeps it pre-money. Add the amount raised to get the post-money valuation.
Who created the risk factor summation method?
Bill Payne attributed it to the Ohio TechAngels, an angel group, when he described it in 2011. His 2011 post is the primary written source.
Can you use it for a company with revenue?
Payne described it for pre-revenue companies. Once a company has revenue, value it on revenue and comparable deals, and use the 12 risks only as a checklist.
Should the 12 risks be weighted?
Payne's version gives every risk the same -2 to +2 range. The Ohio TechAngels text calls management the largest risk, so you may decide it deserves more room. If you weight a risk, say so in the memo and keep the step the same for the others.
Can the method produce a negative valuation?
Yes, on a small baseline. With Payne's $2.0 million average and a $250,000 step, a net score of -8 gives zero, and anything lower is negative. A result that low means the company does not fit the baseline.
How is it different from the scorecard method?
The scorecard method multiplies a baseline by weighted scores on a short list of strengths. Risk factor summation adds or subtracts fixed amounts across 12 risks, including outside risks the scorecard does not list.
Find roles at VC firms
Valuation work like this is part of the job for analysts and associates at angel groups, pre-seed funds and seed funds. Browse VC firms that are hiring, see open venture capital jobs and set up job alerts for analyst and associate roles. To keep building your valuation toolkit, read the guide to the Berkus method.
Related posts
Growth equity buys minority stakes in proven, growing companies; venture capital backs startups still proving the market. Compare stage, risk, terms, secondaries, loss ratios, 2026 round sizes and careers.
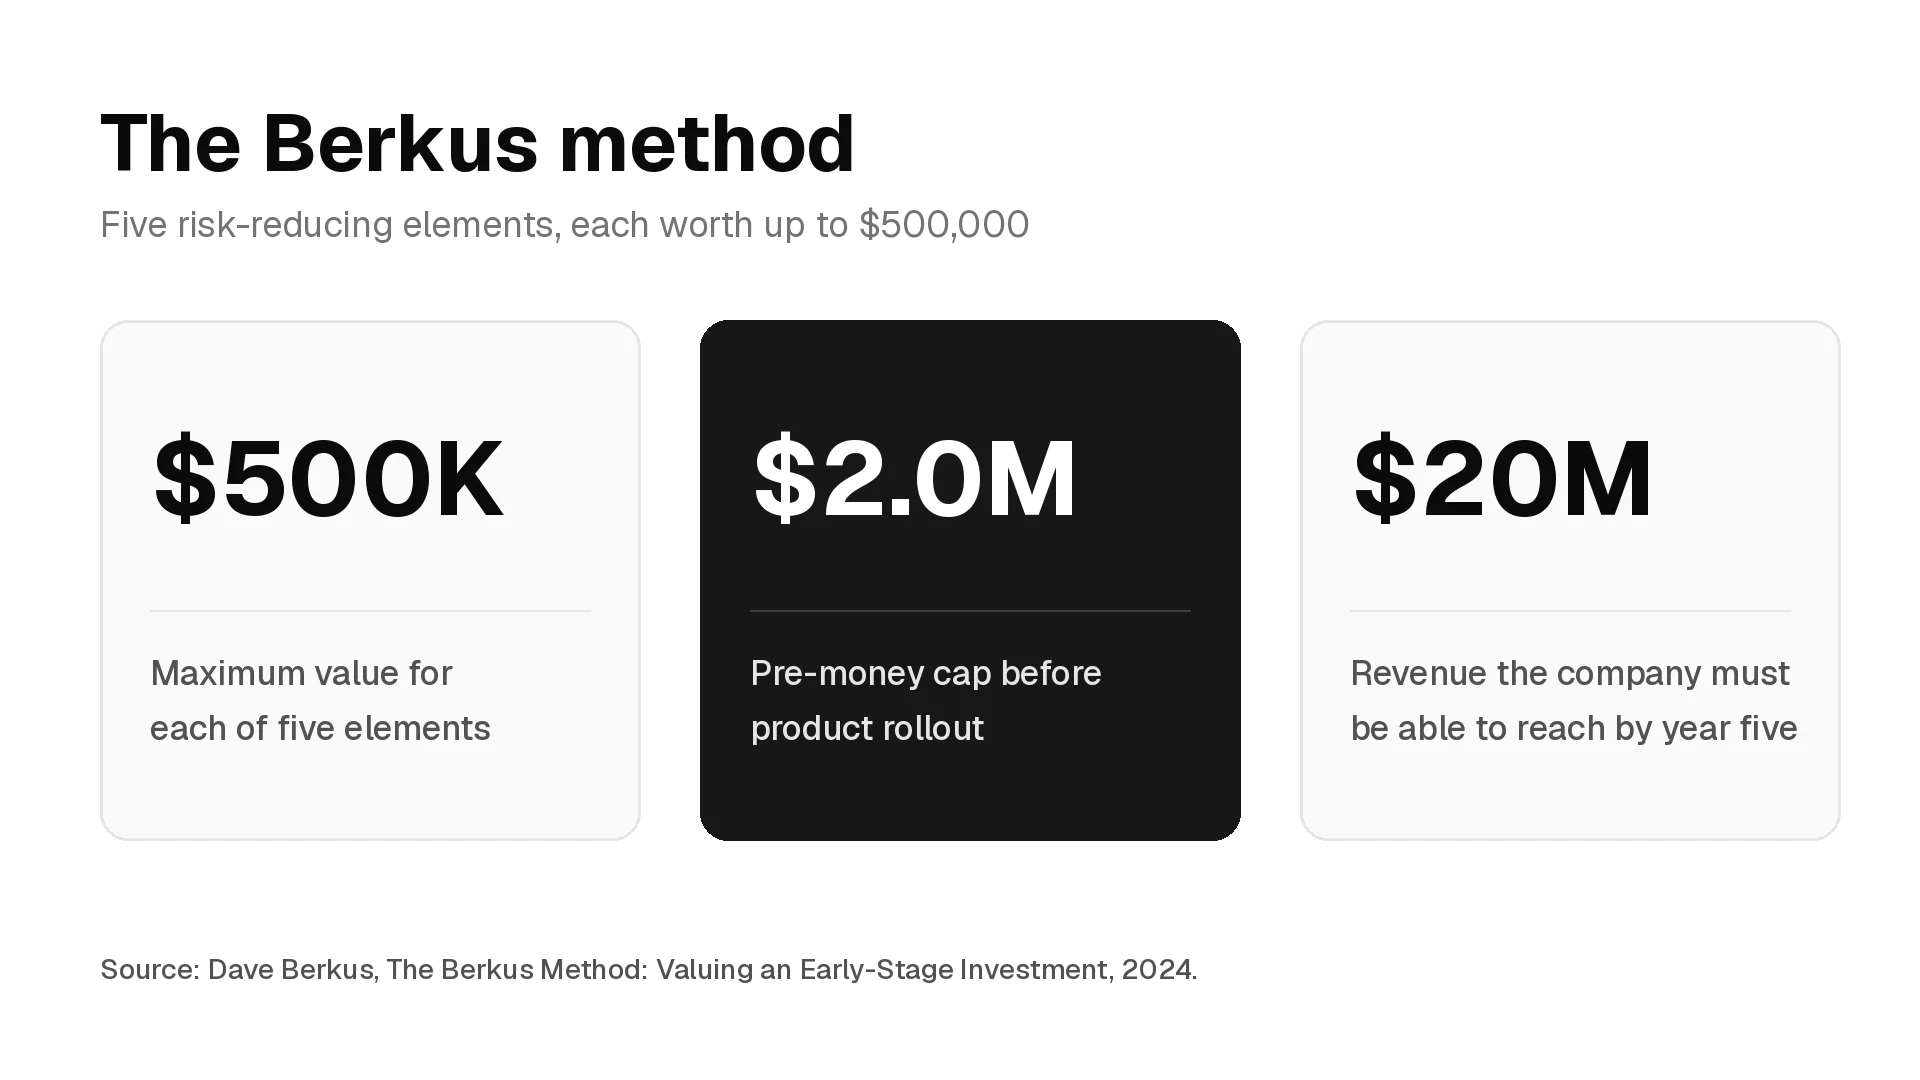
How the Berkus method values a pre-revenue startup, how to score each of the five elements, a worked example with ownership and 10x checks, how the $500,000 caps compare with current seed prices, and how VC analysts use it in memos and interviews.
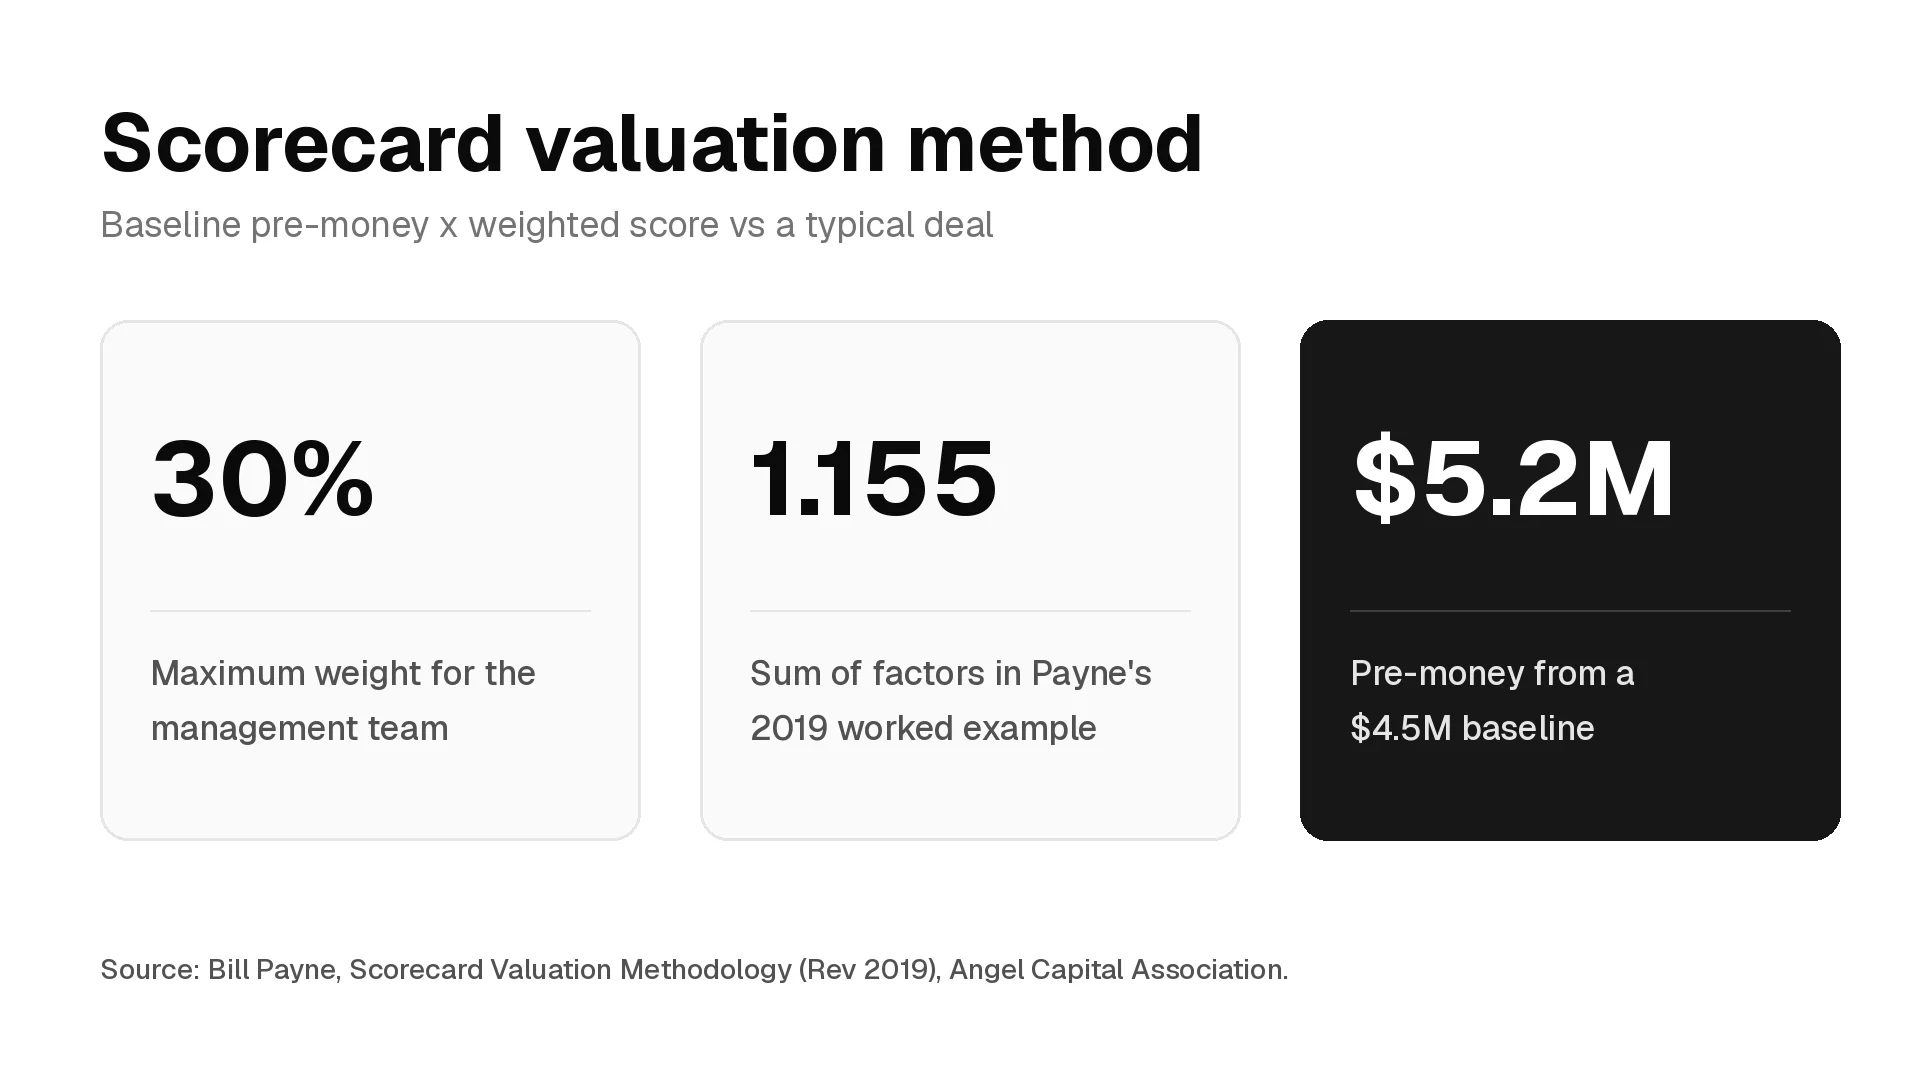
How the scorecard valuation method works, Bill Payne's seven factor weights, his worked example with the arithmetic checked, how to choose the baseline with current seed data, how sensitive the answer is, and how VC analysts use it in memos and interviews.