
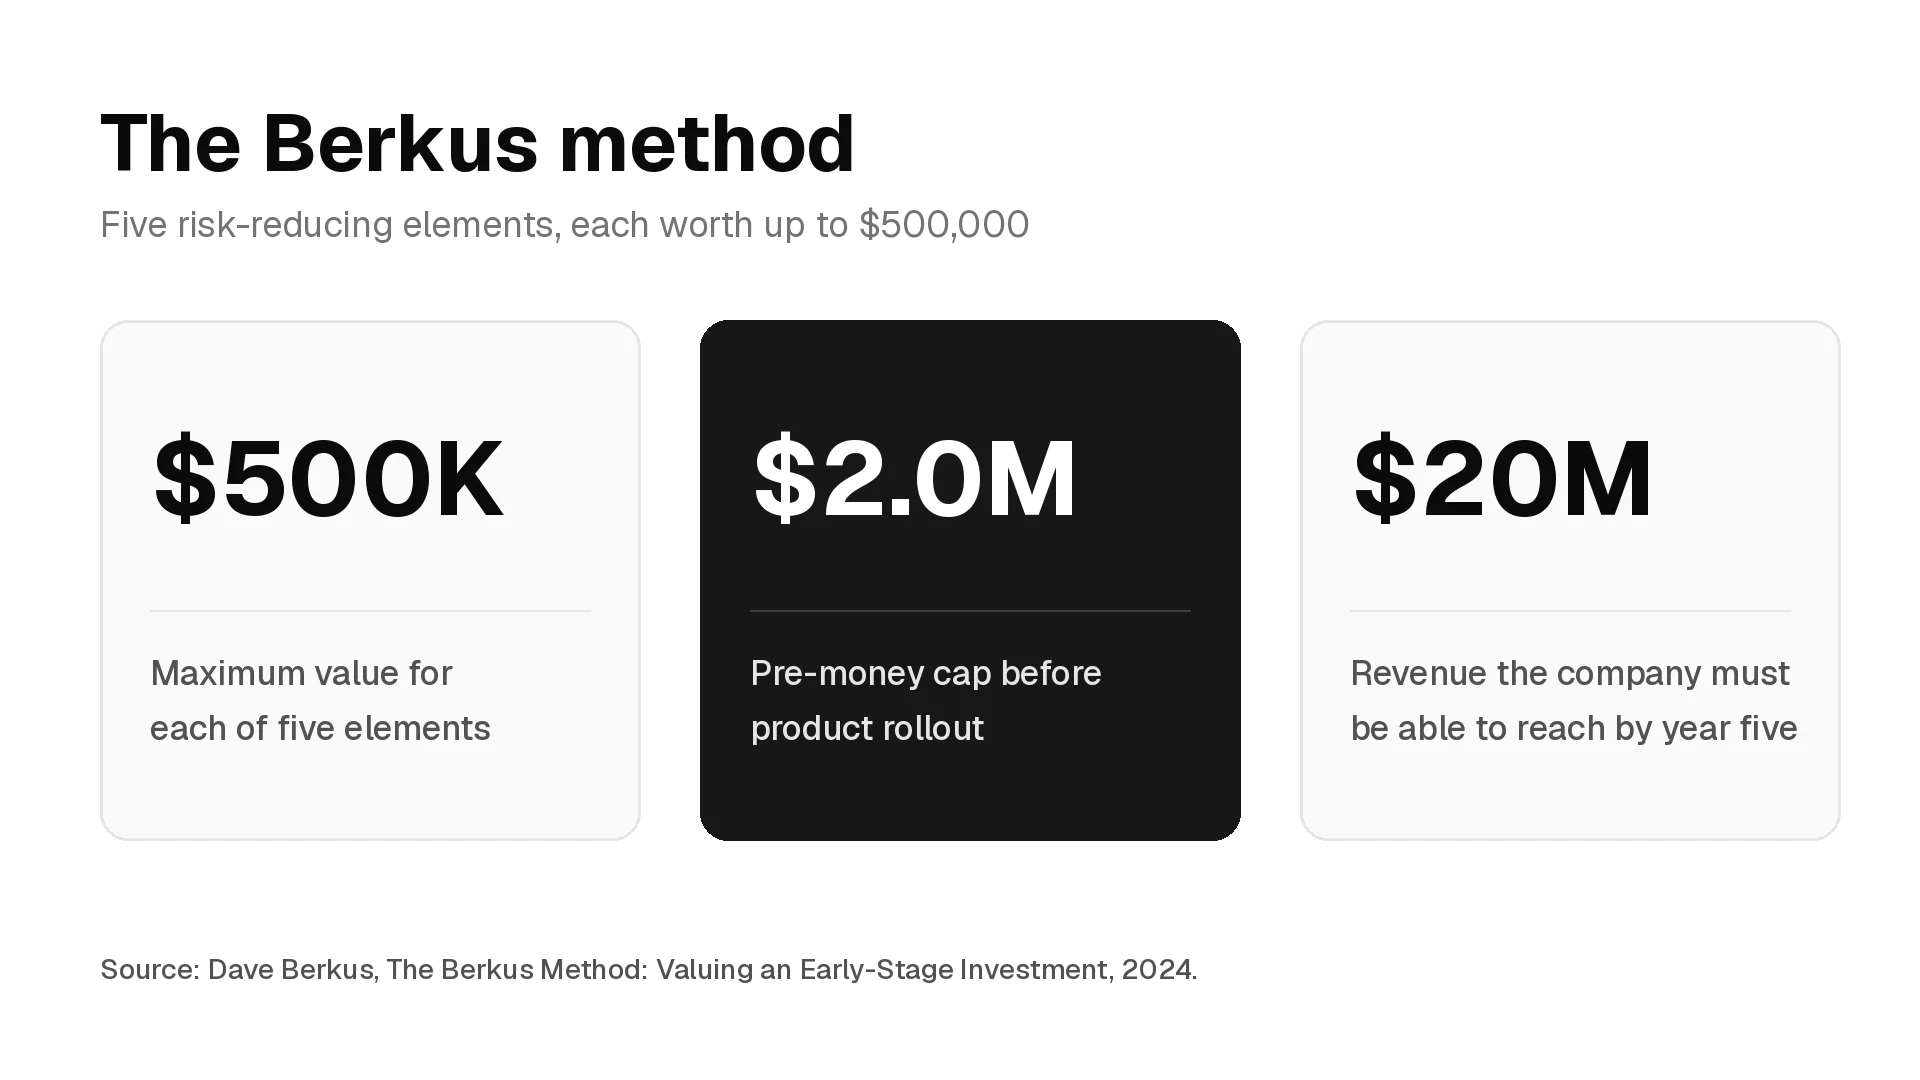
The Berkus method values a pre-revenue startup by adding up to $500,000 for each of five elements: a sound idea, a prototype, a quality management team, strategic relationships and product rollout or sales. That caps the pre-money valuation at $2 million before rollout and $2.5 million after it. Dave Berkus built the method in the mid-1990s for companies that could reach $20 million in revenue by year five, and since 2016 he has said the caps should move with region, sector and the market.
This guide is for analysts and associates at angel groups, pre-seed funds and seed funds, and for candidates who expect a valuation question in a VC interview. It covers how the method works, how to score each element, a worked example, how the caps compare with current seed prices, and how the method fits into investment memos and interviews.
What the Berkus method is
The Berkus method is a way to put a number on a startup that has no revenue to value. Dave Berkus, an angel investor, devised it in the middle 1990s. It was first published widely in Winning Angels by Amis and Stevenson in 2001, and Berkus still publishes the current version on his blog. In his November 2024 post on the method, he starts from one observation: "less than one in a thousand startups meet or exceed their projected revenues in the periods planned."
So the method ignores the founder's forecast. It gives value to progress that removes a specific risk, such as a working prototype that removes technology risk. The result is a pre-money valuation, the value of the company before the new money comes in.
Berkus attaches three conditions to it:
- Pre-revenue only. Once a company has been making revenue for any period of time, he says the method no longer applies, because investors will use actual revenue to value it.
- A $20 million screen. The investor must believe the company could reach over $20 million in revenue by the fifth year. The forecast is used only as this filter, never as an input to the number.
- Room for a 10x return. Values must stay low enough to cover the investor's risk and to give the investment a chance at a tenfold increase over its life.
How the Berkus method works
The method lists five elements. Each one can add up to $500,000 to the valuation, and each is tied to the risk it reduces.
| Element | Risk it reduces | Maximum value |
|---|---|---|
| Sound idea | Basic value and product risk | $500,000 |
| Prototype | Technology risk | $500,000 |
| Quality management team | Execution risk | $500,000 |
| Strategic relationships | Market and competitive risk | $500,000 |
| Product rollout or sales | Financial or production risk | $500,000 |
Element names and risks follow Berkus's November 2024 version of the method.
The process has four steps:
- Run the $20 million screen. If the company could not plausibly reach $20 million in revenue by year five, stop and use another method.
- Score each element. Give each one a value from $0 to its maximum, based on evidence you can check.
- Add the five values. The sum is the pre-money valuation.
- Check the result. Make sure the price leaves room for a 10x return at the round size being raised.
Pre-money valuation = idea + prototype + team + strategic relationships + rollout or sales
Each element: $0 to $500,000
Maximum before rollout: $2.0 million
Maximum after rollout: $2.5 million
Berkus calls these numbers maximums that can be "earned". Most companies earn well below them. The fifth element only scores once a product is in the market, which is why the cap for a company that has not rolled out is $2 million rather than $2.5 million.
How to score each element
Berkus gives the maximums but no scoring scale, so the score is the investor's judgment. The way to make that judgment defensible is to tie each score to evidence someone else could check. The table below is a working guide for an analyst, not part of Berkus's text.
| Element | Evidence that earns most of the maximum | Evidence that earns little |
|---|---|---|
| Sound idea | A defined buyer with a costly problem, a market big enough to pass the $20 million screen, a clear way to charge | An idea with no named customer or a market that tops out below the screen |
| Prototype | A working product in the hands of target users, or a passed regulatory milestone for a regulated product | Slides, mockups or a demo that only the founder can run |
| Quality management team | Founders who have built or sold in this market, technical and commercial leads in place, full-time commitment | A solo founder, missing key skills, part-time founders |
| Strategic relationships | Signed pilots, distribution or channel agreements, letters of intent from named customers | Introductions and informal conversations |
| Product rollout or sales | Product launched, first paying customers or signed orders | Not launched |
Berkus has added a few scoring rules in replies to readers:
- Patents. He counts patents in the market validation element by raising its value, and notes that defending and prosecuting patents costs enough to offset much of the advantage. That reply sits under his 2016 update to the method.
- Cash in the bank. Cash does not add to the valuation. In a 2020 reply under his 2009 post on the method, he explains that a $2 million valuation with $1 million in cash would not become a $3 million valuation, because the cash will be spent growing the business.
- Swapping elements. The five tests can be changed to fit the business. His example is a drug developer that uses stages of FDA approval in place of the prototype.
Berkus method example
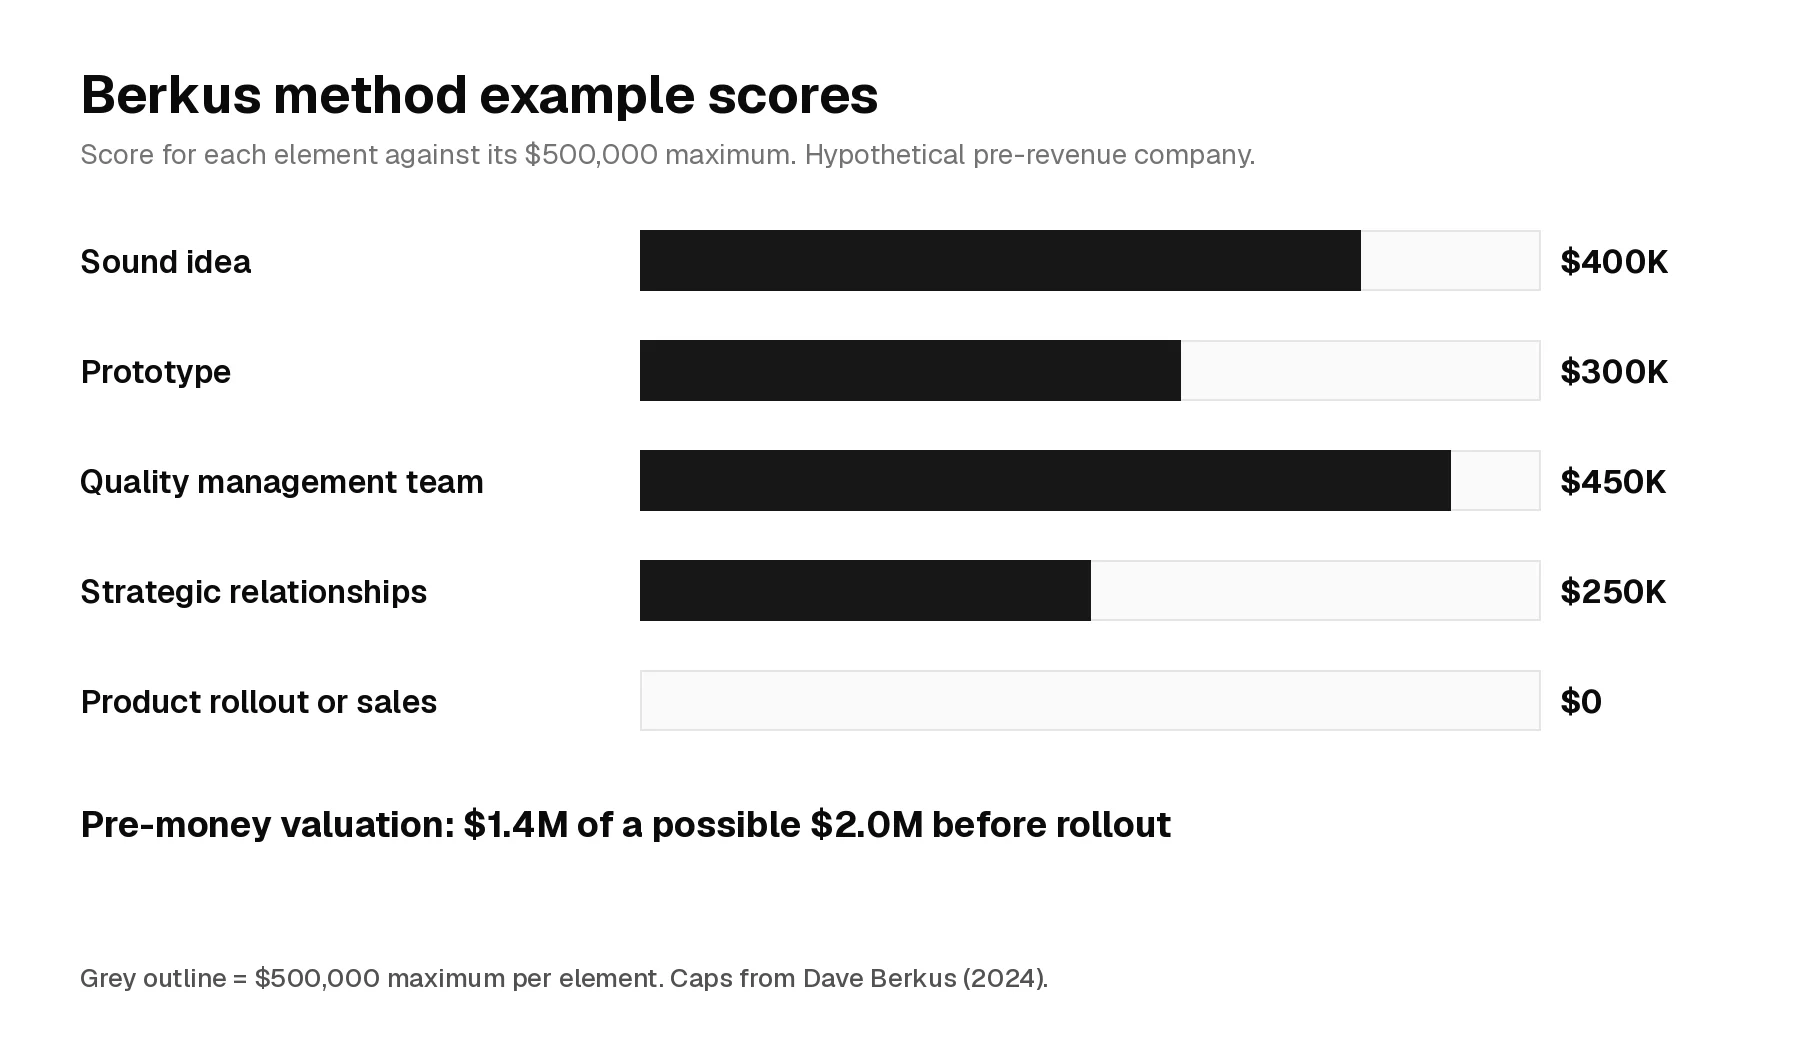
The company below is hypothetical. It is a pre-revenue software company selling to freight brokers, raising $350,000 from an angel group. The analyst believes it could pass $20 million in revenue by year five, so it clears the screen.
| Element | Evidence | Score |
|---|---|---|
| Sound idea | Brokers lose margin on manual load matching; the market supports the screen | $400,000 |
| Prototype | Working beta used weekly by three design partners | $300,000 |
| Quality management team | Two founders from a freight software company, technical and sales leads in place | $450,000 |
| Strategic relationships | Two signed pilot letters, no distribution deal yet | $250,000 |
| Product rollout or sales | Not launched | $0 |
| Pre-money valuation | $1,400,000 |
Now the checks an investor would run on that number:
- Post-money and ownership. A $350,000 raise on a $1.4 million pre-money gives a post-money valuation of $1.75 million. The new investors own 20%.
- The 10x check. A 10x return on $350,000 is $3.5 million. At 20% ownership with no later dilution, the company has to exit for $17.5 million. If later rounds cut the stake in half to 10%, it has to exit for $35 million. The analyst asks whether a company that passes the $20 million revenue screen could plausibly sell for that.
- What moves the answer. Each element moves the total by at most $500,000. Raising the prototype score to the maximum gives $1.6 million. Dropping strategic relationships to zero gives $1.15 million. The bigger lever is the cap itself, covered in the next section.
Do the $500,000 caps still hold?
Berkus says they are a guide. In his 2016 update he wrote that the original matrix had become "too restrictive" and should be a suggestion rather than a rigid form. Users should pick the risks that matter for the company and set maximums that fit the industry and the times. His example was a "big data" startup that might call for $1.5 million per element in Silicon Valley, where $500,000 might suit the same startup in Nebraska. The 2024 version still lists $500,000 per element and adds that "there is nothing wrong with placing higher individual maximums" for geography or business type.
He has also given a rule for setting local caps. In a 2021 reply under the 2016 update, he told a reader to find the average valuation of pre-revenue startups in their area and divide it by five. That figure becomes the maximum for each element. A hypothetical local average of $4.0 million gives an $800,000 cap per element. The example company above, keeping the same share of each maximum, would then come out at $2.24 million.
He has rejected a simple inflation adjustment. Asked in 2022 whether $500,000 from 1999 should now be worth over $900,000, he answered "Not at all", citing lower valuations after market falls, more deals competing for funds and wide regional differences. "This is an art not a science," he wrote, and "a single number like $500,000 is only a guide not a rule."
How the caps compare with today's seed prices
Broad US seed rounds now price far above the Berkus caps. The PitchBook-NVCA Venture Monitor for Q3 2026 puts the median US seed pre-money valuation at $16.0 million in 2025 and $18.3 million in 2026 through September 30, with a median seed deal size of $3.0 million in 2026.
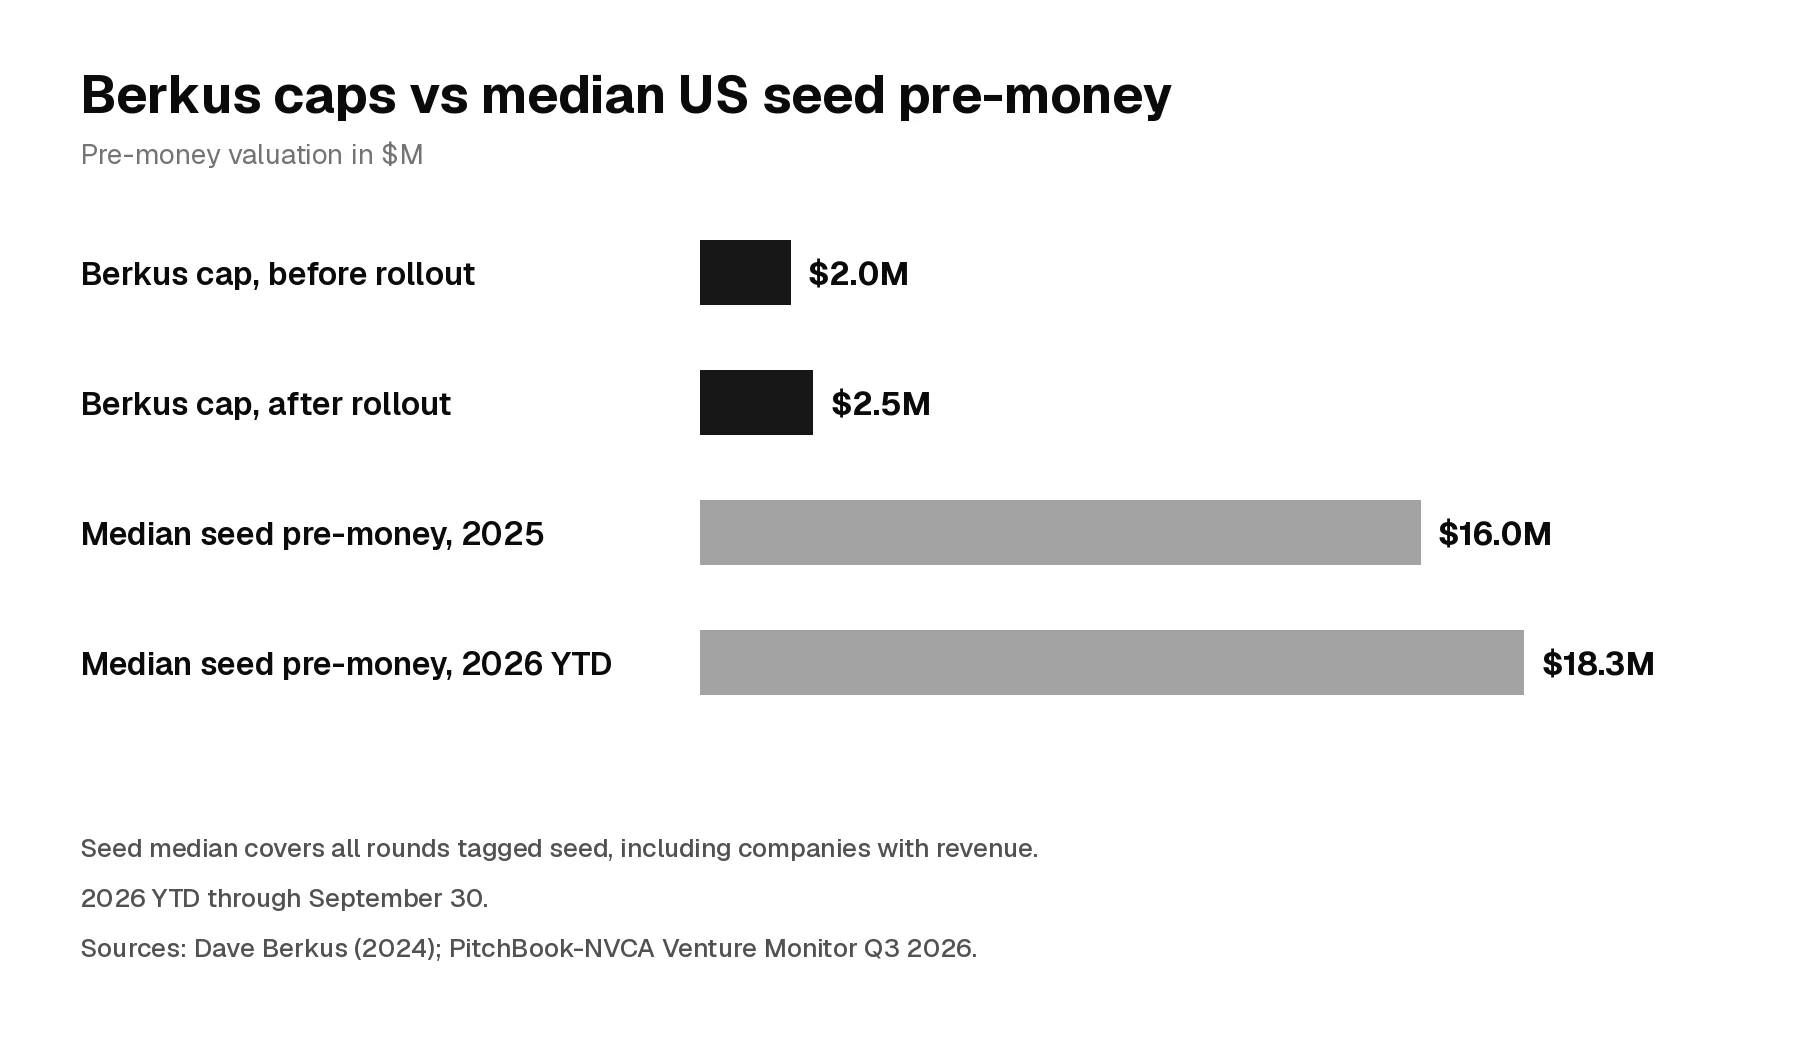
That gap does not mean the method is wrong. PitchBook tags a round as seed when investors or the press release call it that, so its median includes companies with revenue and well-known founders. The default Berkus caps fit small angel and pre-seed checks into pre-revenue companies. For anything closer to a priced seed round, use local caps, a scorecard valuation with a comparable baseline, or both. Don't divide a broad seed median by five, because that median is not limited to pre-revenue companies.
When not to use the Berkus method
Berkus's own posts and replies rule out several cases:
- Companies with revenue. Once revenue exists, value it on revenue.
- Lifestyle and service businesses. In a July 2026 reply under the 2024 post, he wrote that these "cannot easily fit" the method.
- Long regulatory timelines. In a 2020 reply under the 2009 post, he said the $20 million test makes little sense in industries such as pharma. A company that fails the screen with a lower target is not worthless, he added. A lower number "does reduce the valuation a bit but not in proportion."
Common mistakes
- Reading the elements as a ladder. Some copies print the elements as stacked ranges, so the team appears to be worth $500,000 to $1 million. Each element is scored on its own from $0 to its maximum, and the scores are added. Berkus confirmed in 2021: "add the scores to obtain the valuation."
- Using the $2.5 million cap before launch. The extra $500,000 only applies after product rollout.
- Adding the cash in the bank. Investors ignore cash the company already holds, because it will be spent.
- Copying old caps into a different market. The defaults reflect US angel pricing. Set local caps with the divide-by-five rule.
- Treating the output as a precise price. The sum is a starting point for negotiation. In the same July 2026 reply, Berkus called the $500,000 figure "completely arbitrary" and wrote that "it is what an investor will agree to that matters most."
- Skipping the screen. A strong team and prototype in a small market still fail the $20 million test.
Berkus vs scorecard, risk factor summation and the VC method
| Method | Starting point | How it adjusts | Best fit |
|---|---|---|---|
| Berkus | No market baseline | Adds up to $500,000 for each of five milestones that reduce risk | Pre-revenue companies with a path to $20 million in revenue, where only milestones can be judged |
| Scorecard | Median pre-money of comparable recent deals | Multiplies the baseline by weighted scores against a typical deal | Pre-revenue companies with good regional comparables |
| Risk factor summation | A baseline valuation | Adds or subtracts set amounts for a list of risk types | A second check on a baseline result, focused on risk |
| VC method | Expected exit value | Works back from the exit at a target return, adjusted for dilution | Companies where an exit value can be estimated |
| First Chicago method | Several outcome scenarios | Weights each scenario's value by its probability | Companies with very different possible outcomes |
The Berkus method is the only one of these with no link to market prices. That makes it quick and easy to explain, and it is why it is usually paired with a market-based method. The scorecard valuation method starts from what similar companies raised at. The VC method starts from the exit and the return the fund needs. The First Chicago method handles companies whose outcomes could split widely.
How VC analysts use the Berkus method
At angel groups, pre-seed funds and accelerators that see many pre-revenue companies, the Berkus method is a fast first pass. It helps an analyst decide whether the price a founder asks for is in range for the evidence before spending time on a full model.
- Screening a SAFE cap. Many pre-revenue rounds are raised on a SAFE or a convertible note with a valuation cap. A Berkus sum, with caps set for the local market, gives a quick read on whether the cap reflects what the company has proven.
- Structuring diligence. Each element maps to a due diligence task. The prototype score needs a product demo or a technical review. The team score needs reference calls and a founder-market fit read. The strategic relationships score needs calls with the named partners and a read of the signed letters.
- Writing the memo. In an investment memo, show the element table with an evidence column, the reasoning behind the $20 million screen, the post-money and ownership, and the 10x check. Add a scorecard or VC method cross-check, and explain the gap if the two disagree.
- Tracking progress. Because each element is a milestone, the same table shows what the company must prove before the next round to earn a higher price. Ownership effects of that next round belong on the cap table.
How to answer a Berkus question in a VC interview
Valuation questions come up in VC case study interviews and in technical rounds of VC interview questions. A strong answer gives the mechanics, the conditions and the judgment in under a minute:
"The Berkus method values a pre-revenue company by adding up to $500,000 each for a sound idea, a prototype, the team, strategic relationships and rollout or sales, so it caps out at $2 million before launch and $2.5 million after. It only applies if the company could reach $20 million in revenue in five years, and the price has to leave room for a 10x return. The default caps reflect US angel pricing, so I would set local maximums, for example by dividing the average local pre-revenue valuation by five, and cross-check with a scorecard. The useful part is the milestone list, because it shows what the company has proven and what it still has to prove."
If the interviewer gives you a company, score each element out loud with the evidence behind it, then run post-money, ownership and the 10x check.
FAQ
Is the Berkus method pre-money or post-money?
Pre-money. The five values add up to the company's value before the new investment. Add the amount raised to get the post-money valuation.
What is the maximum Berkus valuation?
With the default caps, $2 million for a company that has not rolled out its product and $2.5 million after rollout. Berkus allows higher maximums for expensive regions or business types.
Can you use the Berkus method for a company with revenue?
No. Berkus says the method stops applying once a company has revenue for any period of time. Value it on revenue instead.
How do you adjust the Berkus method for another country?
When a reader asked how to convert the caps into Indian rupees, Berkus's answer was to find the average valuation of pre-revenue startups in the area and divide it by five. Use that as the maximum for each element.
Does the Berkus method count patents or cash?
Berkus counts patents toward market validation, though he notes that their legal costs offset much of the benefit. Cash in the bank adds nothing, because the company will spend it.
Is the Berkus method the same as the scorecard method?
No. Berkus adds capped dollar amounts for milestones with no market baseline. The scorecard method starts from what comparable companies raised at and adjusts it.
Find roles at VC firms
Valuation methods like this one are daily work for analysts at angel groups, pre-seed funds and seed funds. Browse VC firms that are hiring, see open venture capital jobs and set up job alerts for analyst and associate roles. To keep building your valuation toolkit, read the guide to the VC method.
Related posts
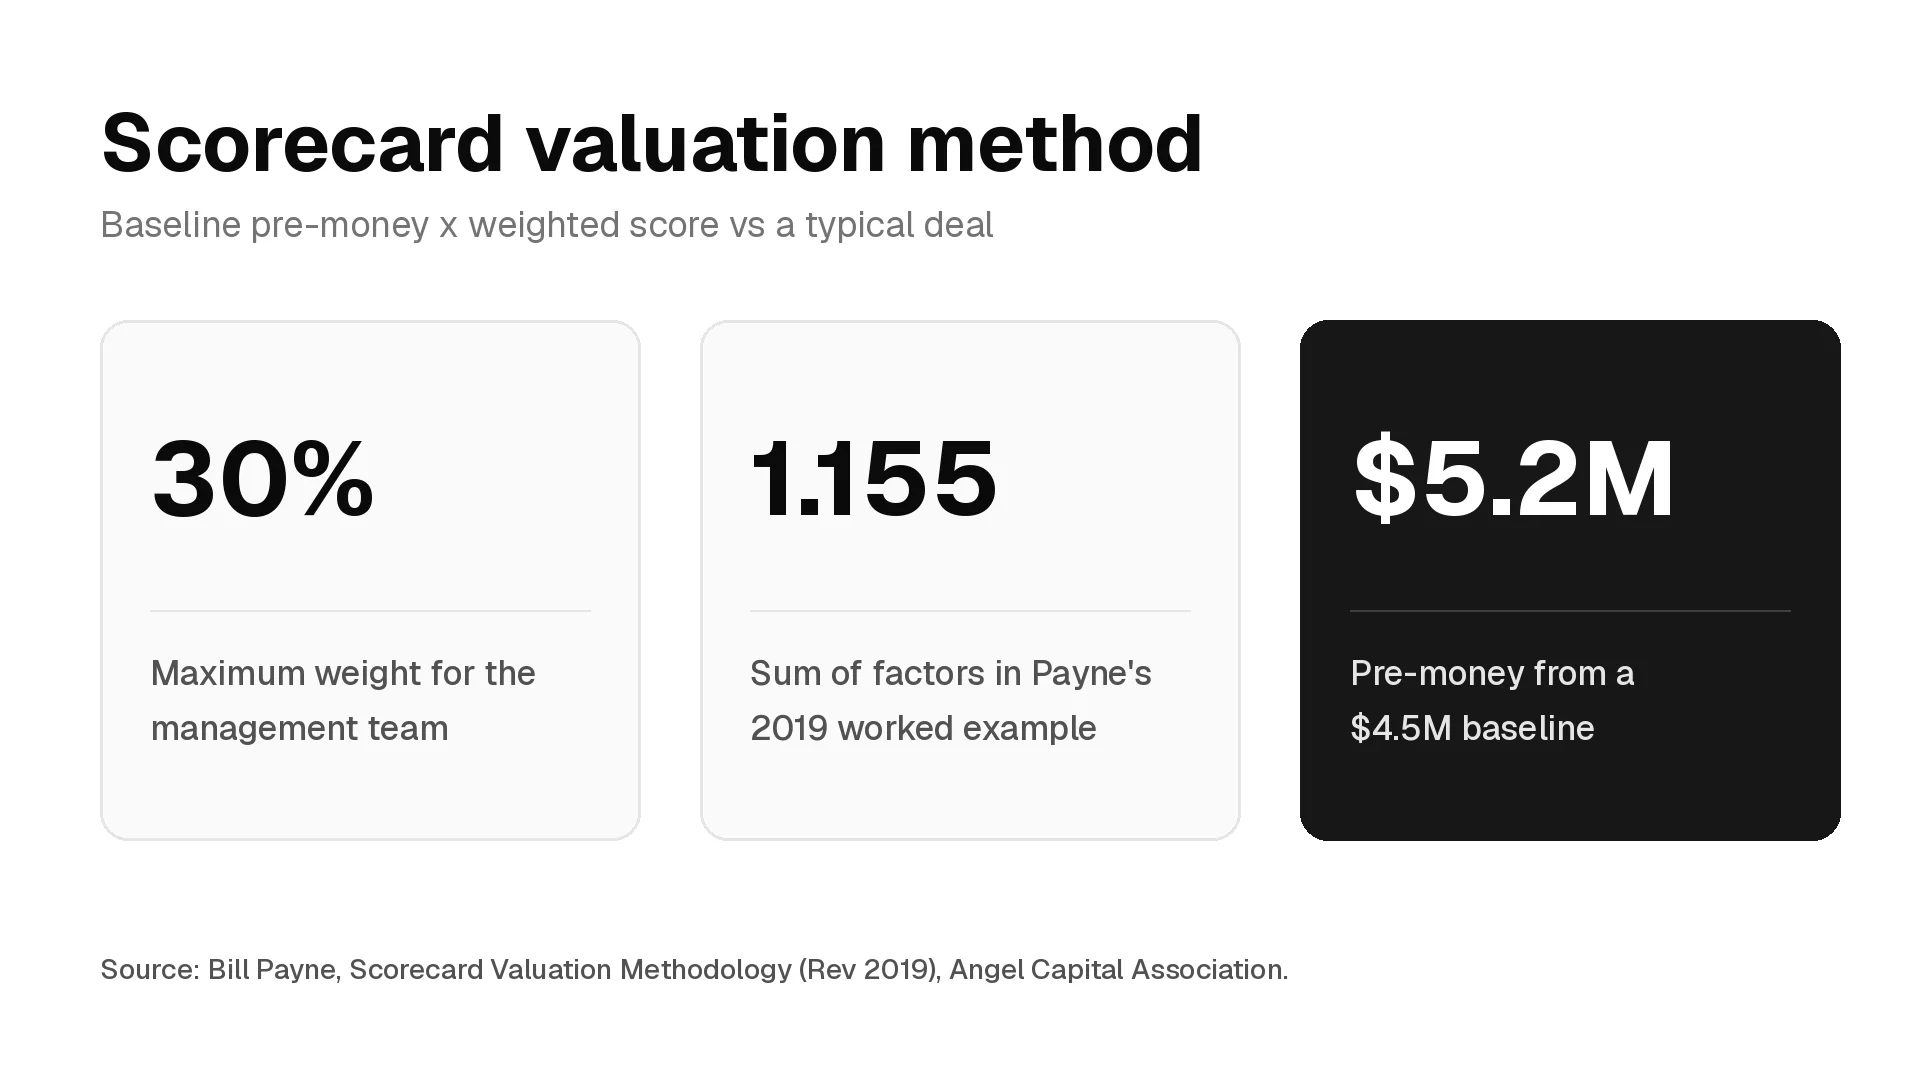
How the scorecard valuation method works, Bill Payne's seven factor weights, his worked example with the arithmetic checked, how to choose the baseline with current seed data, how sensitive the answer is, and how VC analysts use it in memos and interviews.
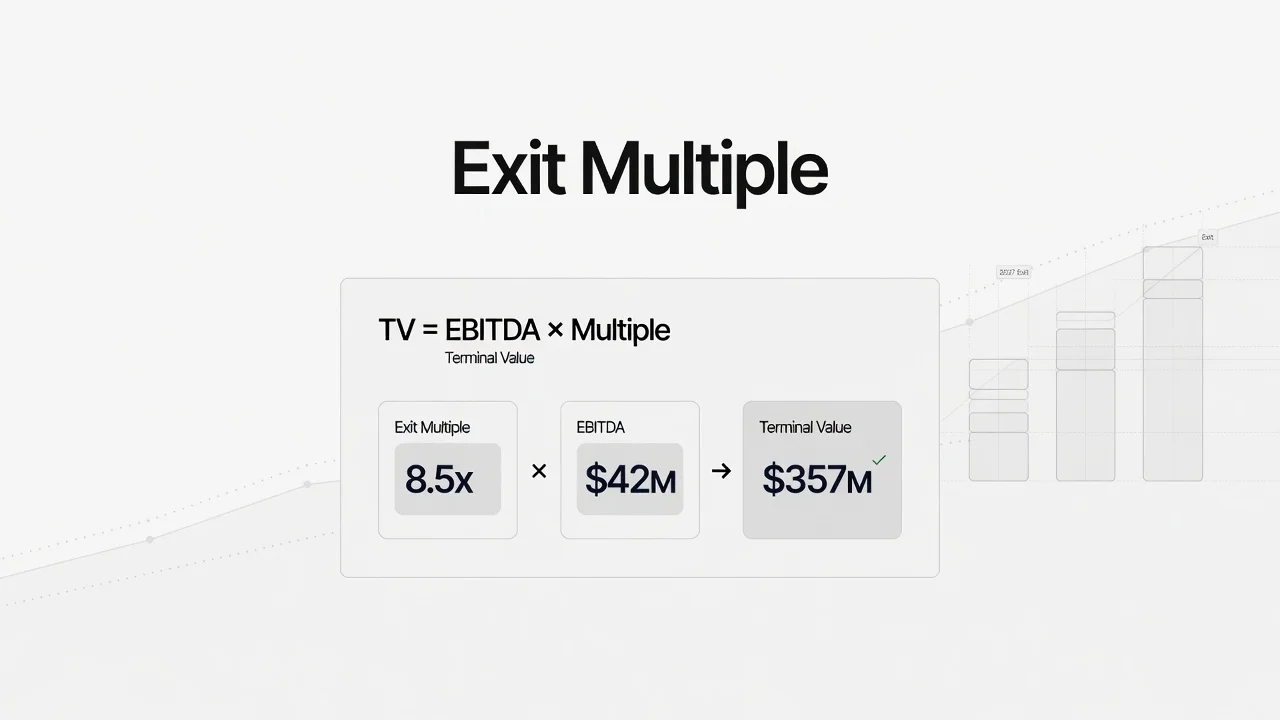
Exit multiple formula, a worked DCF terminal value example with a sensitivity grid, the implied growth cross-check, January 2026 industry multiples, and how VC investors use exit multiples.
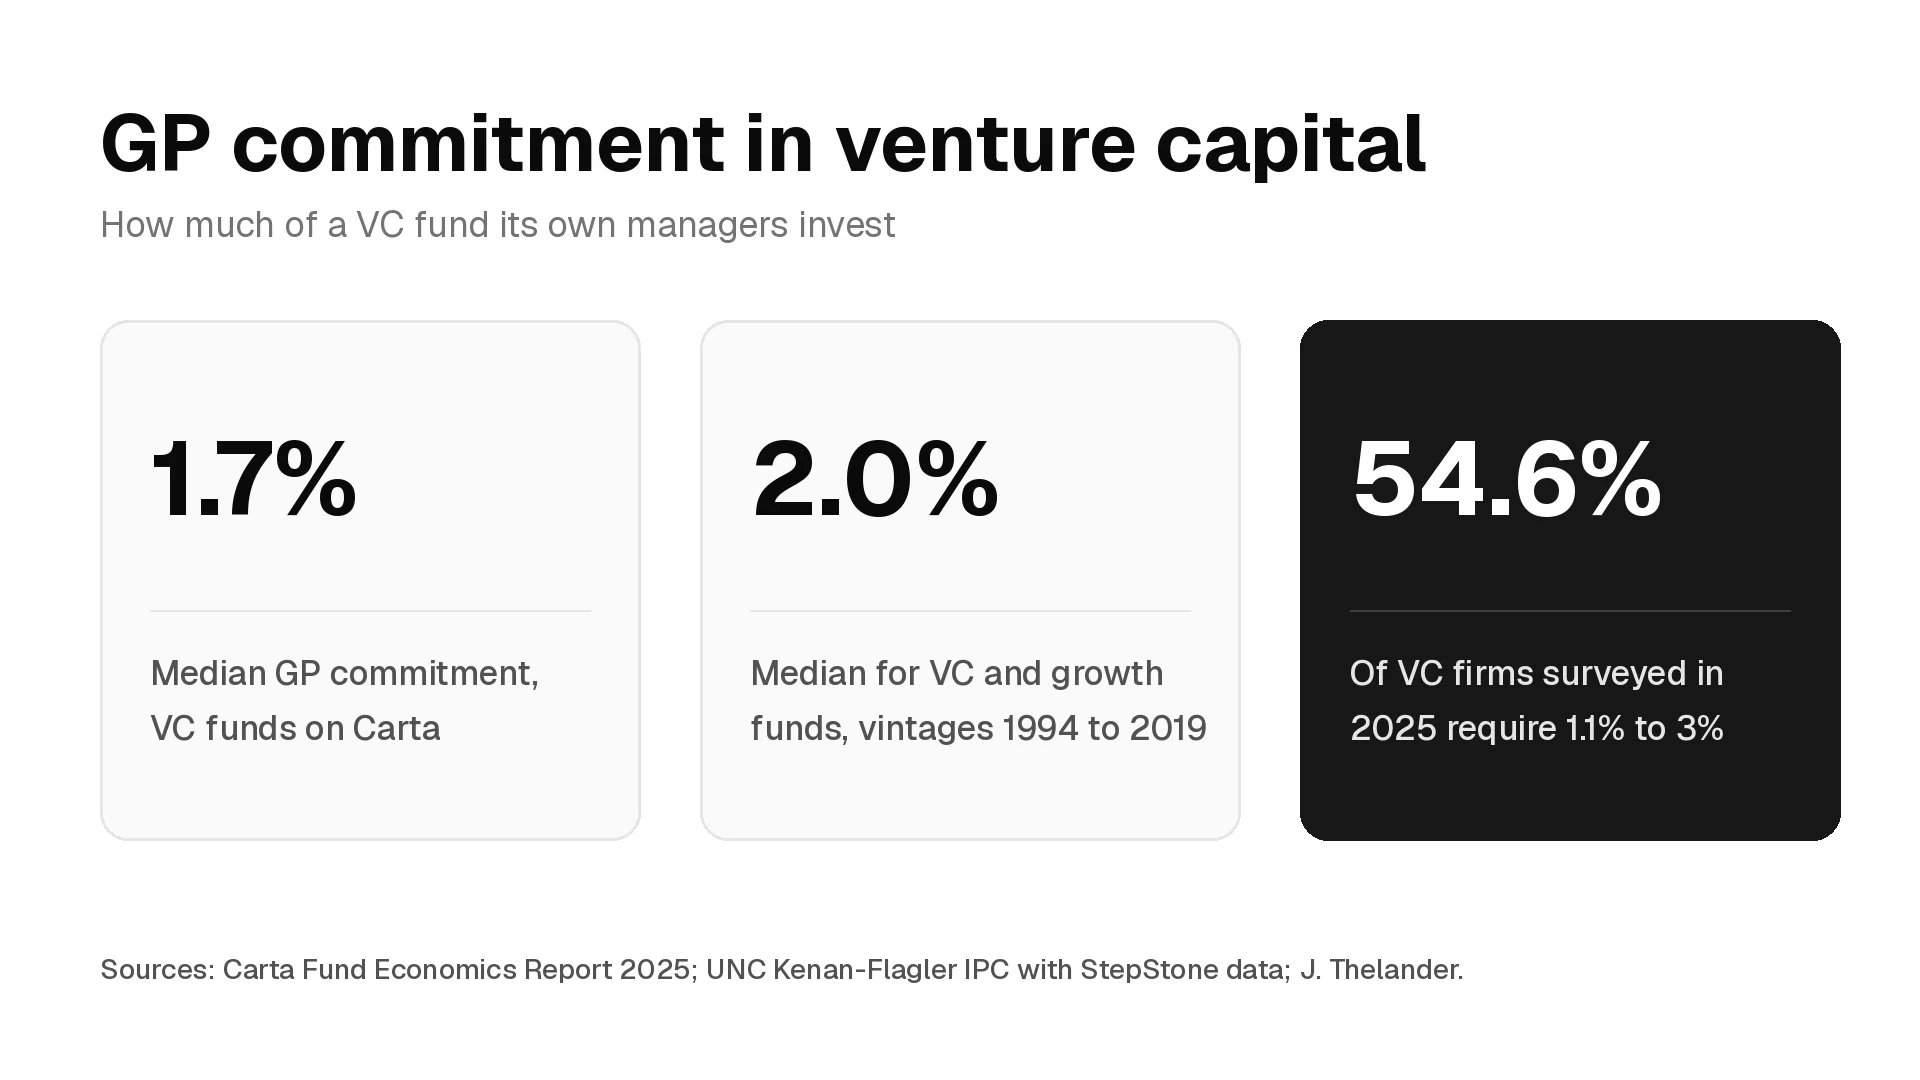
What a GP commitment is, how large it is in venture capital, how GPs fund it, where it sits in the LPA, what the returns evidence says, how firms split it across partners and principals, and what to ask before you accept a role with carry.