
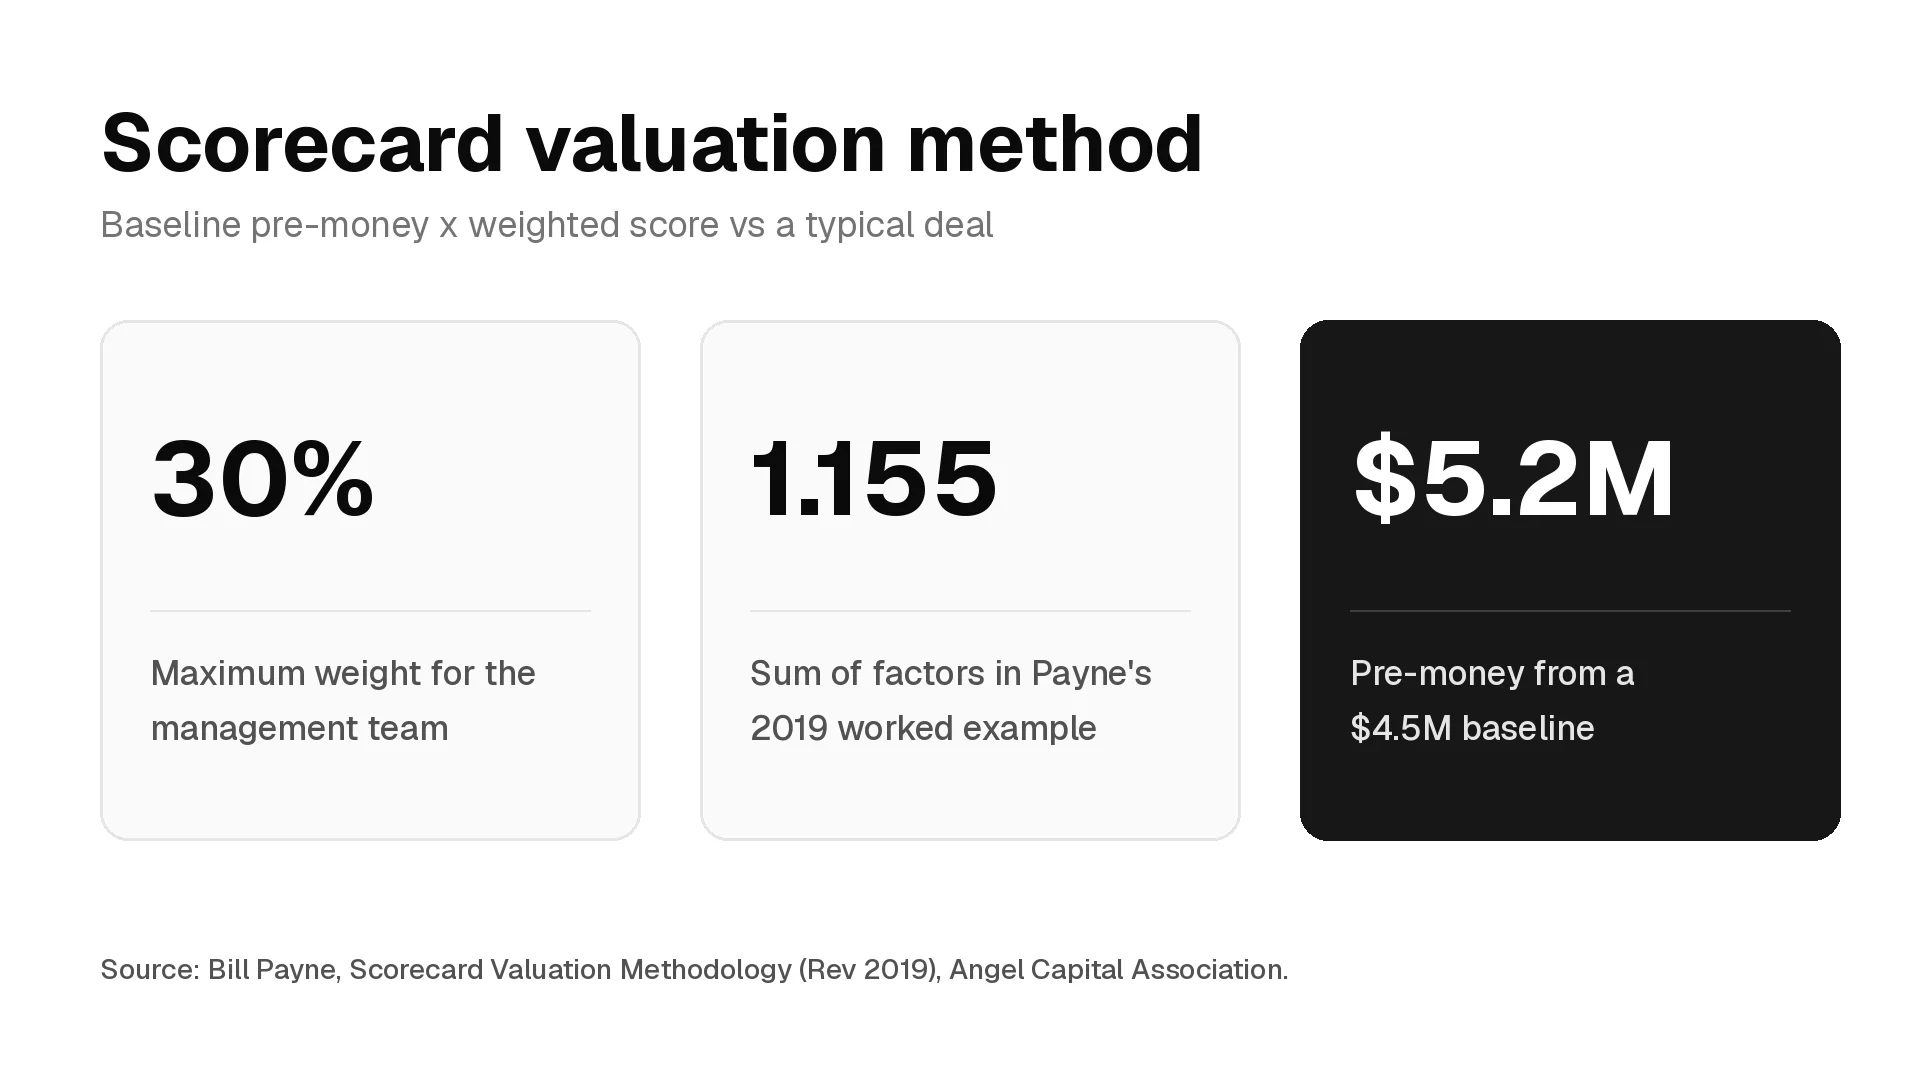
The scorecard valuation method prices a pre-revenue startup by taking the median pre-money valuation of similar recently funded companies and multiplying it by a weighted score of how the target compares. Bill Payne's version uses seven factors, led by the management team at up to 30% and the size of the opportunity at up to 25%. In his 2019 worked example, a sum of factors of 1.155 on a $4.5 million baseline gives a pre-money valuation of just over $5.2 million.
If you work at a seed fund or an angel group, or you are interviewing for one, you will meet the method as a quick check on a round's price and as a case question. The weights are easy to remember. The baseline is the input that moves the answer most, so it is where most of this guide spends its time.
What the scorecard valuation method is
The scorecard method is a relative valuation for companies with little or no revenue. It compares the target with typical angel-funded startups at the same stage and adjusts the median valuation of recent deals in the same region to set the target's pre-money valuation.
Bill Payne, an angel investor with Frontier Angels, first wrote it up in May 2001 and revised it several times. The Angel Capital Association's 2019 revision notes that others call it the Benchmark Method or the Bill Payne Method. Payne describes it as useful for most pre-seed and seed opportunities, except companies that need very large amounts of capital before first revenue, such as some life science and energy deals.
The method does not forecast cash flows or an exit. It answers a narrower question: compared with the typical company that raised in this market recently, is this one better or worse, and by how much?
How the scorecard method works
The method has three steps.
- Set the baseline. Find the median pre-money valuation of pre-revenue companies recently funded in the target's region and sector.
- Score the target against the norm. For each factor, rate the target as a percentage of a typical deal: 100% is average, 150% is much stronger, 75% is weaker.
- Weight, sum and multiply. Multiply each score by the factor's weight, add the results to get the sum of factors, and multiply the baseline by that sum.
In formula form:
Pre-money valuation = Baseline median pre-money x Sum of (factor weight x score vs norm)Because the weights add up to 100%, a company that scores exactly average on every factor gets a sum of 1.00 and is valued at the baseline. Every point above or below 1.00 moves the valuation by the same percentage.
The seven factors and their weights
Payne lists the factors in order of importance, with these ranges:
| Factor | Weight (maximum) | What you are comparing |
|---|---|---|
| Strength of the management team | 30% | Founder experience, completeness of the team, coachability |
| Size of the opportunity | 25% | Market size and whether the company can reach the scale investors need |
| Product or technology | 15% | How defined and defensible the product is |
| Competitive environment | 10% | Strength of competitors and barriers to entry |
| Marketing, sales channels and partnerships | 10% | Whether there is a credible route to customers |
| Need for additional investment | 5% | How much more capital is needed before the company is self-sustaining |
| Other | 5% | Anything else, such as early customer feedback |
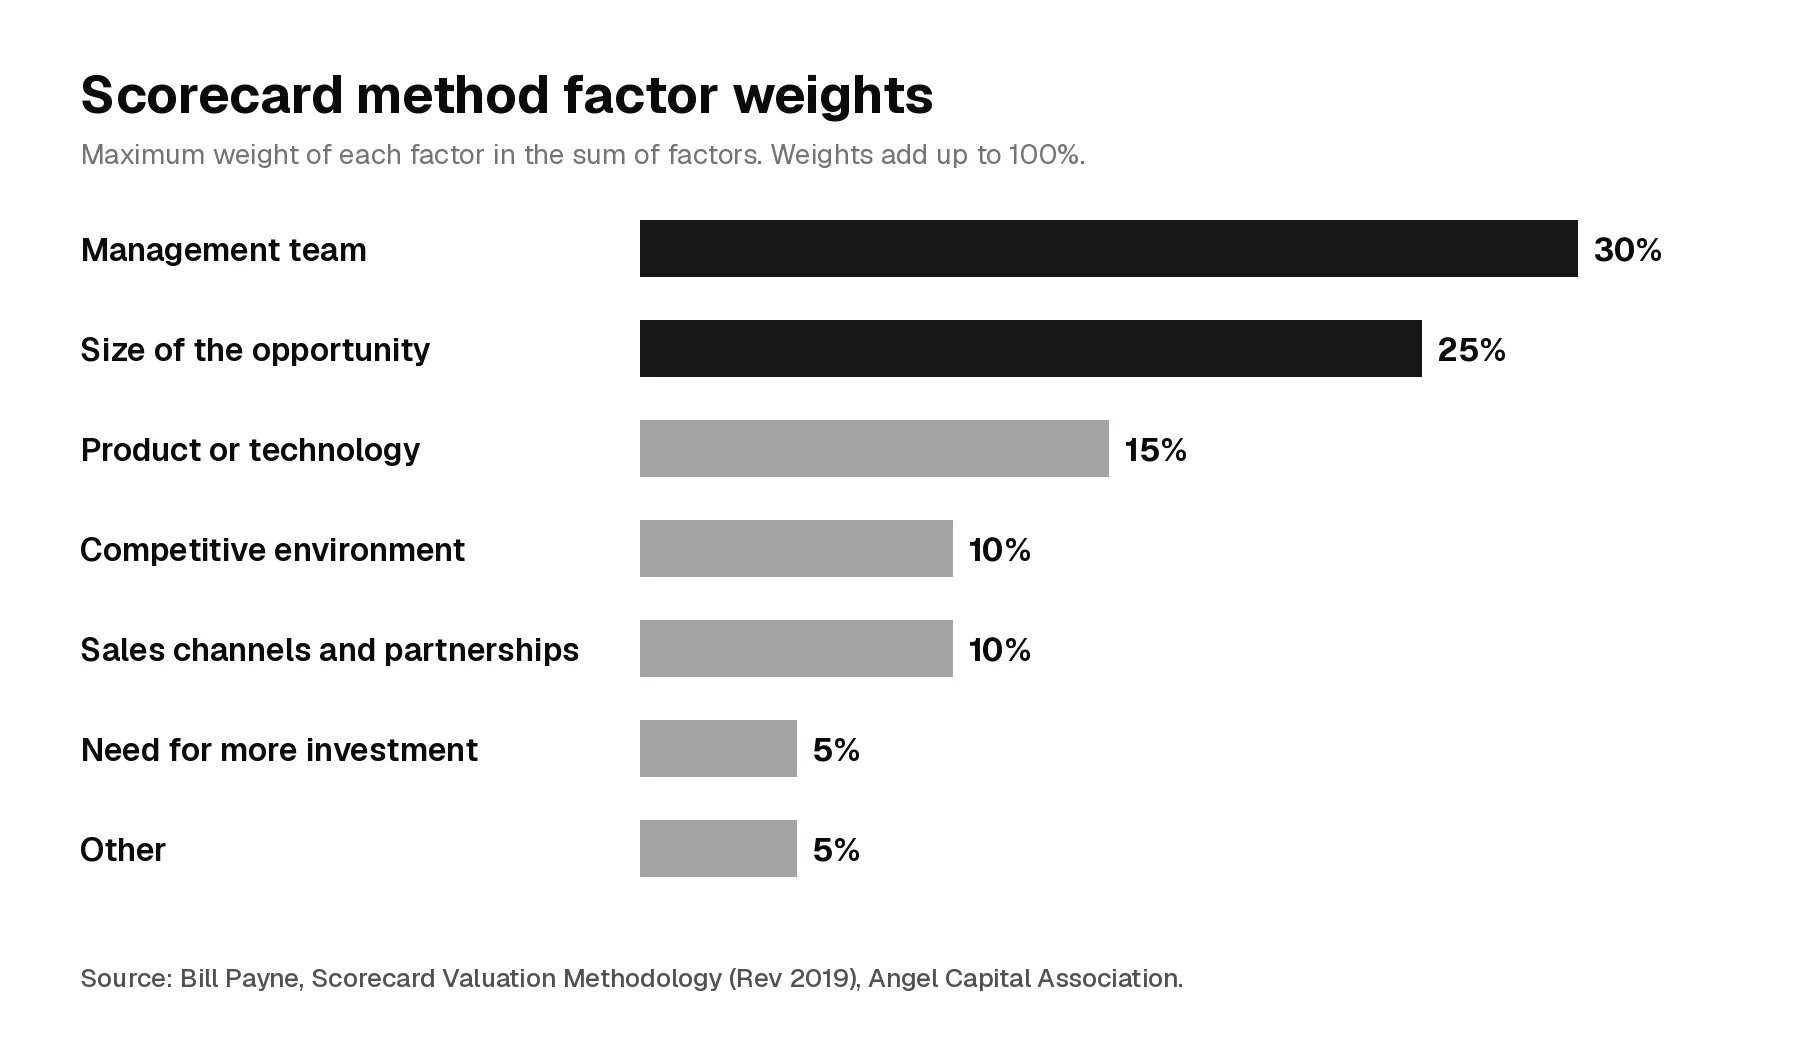
Payne's reasoning for putting product below team and market: a great team will fix early product flaws, but a great product will not fix a weak team. His appendix adds a worksheet that rates sub-issues from very positive to very negative and flags some items, such as a founder who will not take advice, as possible deal-killers.
Scorecard valuation example
Payne's 2019 example starts from a $4.5 million baseline, the midpoint between average pre-seed ($4 million) and seed ($5 million) pre-money valuations he took from angel data. The target has a strong team, a large market, an average product, weaker competition position and sales channels that need work.
| Factor | Weight | Target vs norm | Weighted factor |
|---|---|---|---|
| Management team | 30% | 125% | 0.3750 |
| Size of the opportunity | 25% | 150% | 0.3750 |
| Product or technology | 15% | 100% | 0.1500 |
| Competitive environment | 10% | 75% | 0.0750 |
| Marketing, sales and partnerships | 10% | 80% | 0.0800 |
| Need for additional investment | 5% | 100% | 0.0500 |
| Other (strong early customer feedback) | 5% | 100% | 0.0500 |
| Sum of factors | 100% | 1.1550 |
Pre-money valuation = $4.5 million x 1.155 = $5.20 million.
Copies of the 2011 version of the paper that still circulate online use the same scores but print a sum of 1.075. The weighted factors add up to 1.155. If you rebuild the example in a spreadsheet or a case interview, check the sum yourself rather than copying it.
How to choose the baseline valuation
The baseline is the median pre-money valuation of comparable pre-revenue deals. Payne's guidance is to use the target's own region and sector, at the same stage, and to fall back on national angel data only when local data is thin. He notes that pre-money valuations vary more by region and by local competition for deals than by sector.
Stage matters most. Payne's 2019 baseline of $4.5 million sits at the pre-revenue angel end of the market. Broader seed data sits much higher. In the PitchBook-NVCA Venture Monitor for Q3 2026, the median US seed pre-money valuation was $16.0 million in 2025 and $18.3 million in 2026 through September 30, with a median seed deal size of $3.0 million in 2026. PitchBook tags a round as seed when investors or the press release describe it that way, so that median is not limited to pre-revenue companies.
Run Payne's 1.155 on each baseline and the answers are about $5.2 million and about $21.1 million. Same company, same scores, four times the valuation. Before you trust a scorecard output, check three things about the baseline:
- Stage. Pre-revenue pre-seed, priced seed and post-revenue seed are different markets. Use the one the target is actually raising in.
- Median, not a hand-picked average. A few large rounds pull an average up. Payne's 2019 text uses the median.
- Date. Pricing moves year to year. Payne put typical pre-revenue valuations at $1 million to $2 million in his 2011 version and at $3 million to $8 million in 2018. A baseline from an old report misprices today's market.
How sensitive the result is
The multiplier caps how far a single factor can move the answer, while the baseline moves it one for one. Using Payne's example:
| Change from the 2019 example | Sum of factors | Pre-money |
|---|---|---|
| Payne's example as published ($4.5M baseline) | 1.155 | $5.20M |
| Team scored 150% instead of 125% | 1.230 | $5.54M |
| Market scored 100% instead of 150% | 1.030 | $4.64M |
| Every factor at 100% (average company) | 1.000 | $4.50M |
| Baseline $4.0M (pre-seed figure) | 1.155 | $4.62M |
| Baseline $5.0M (seed figure) | 1.155 | $5.78M |
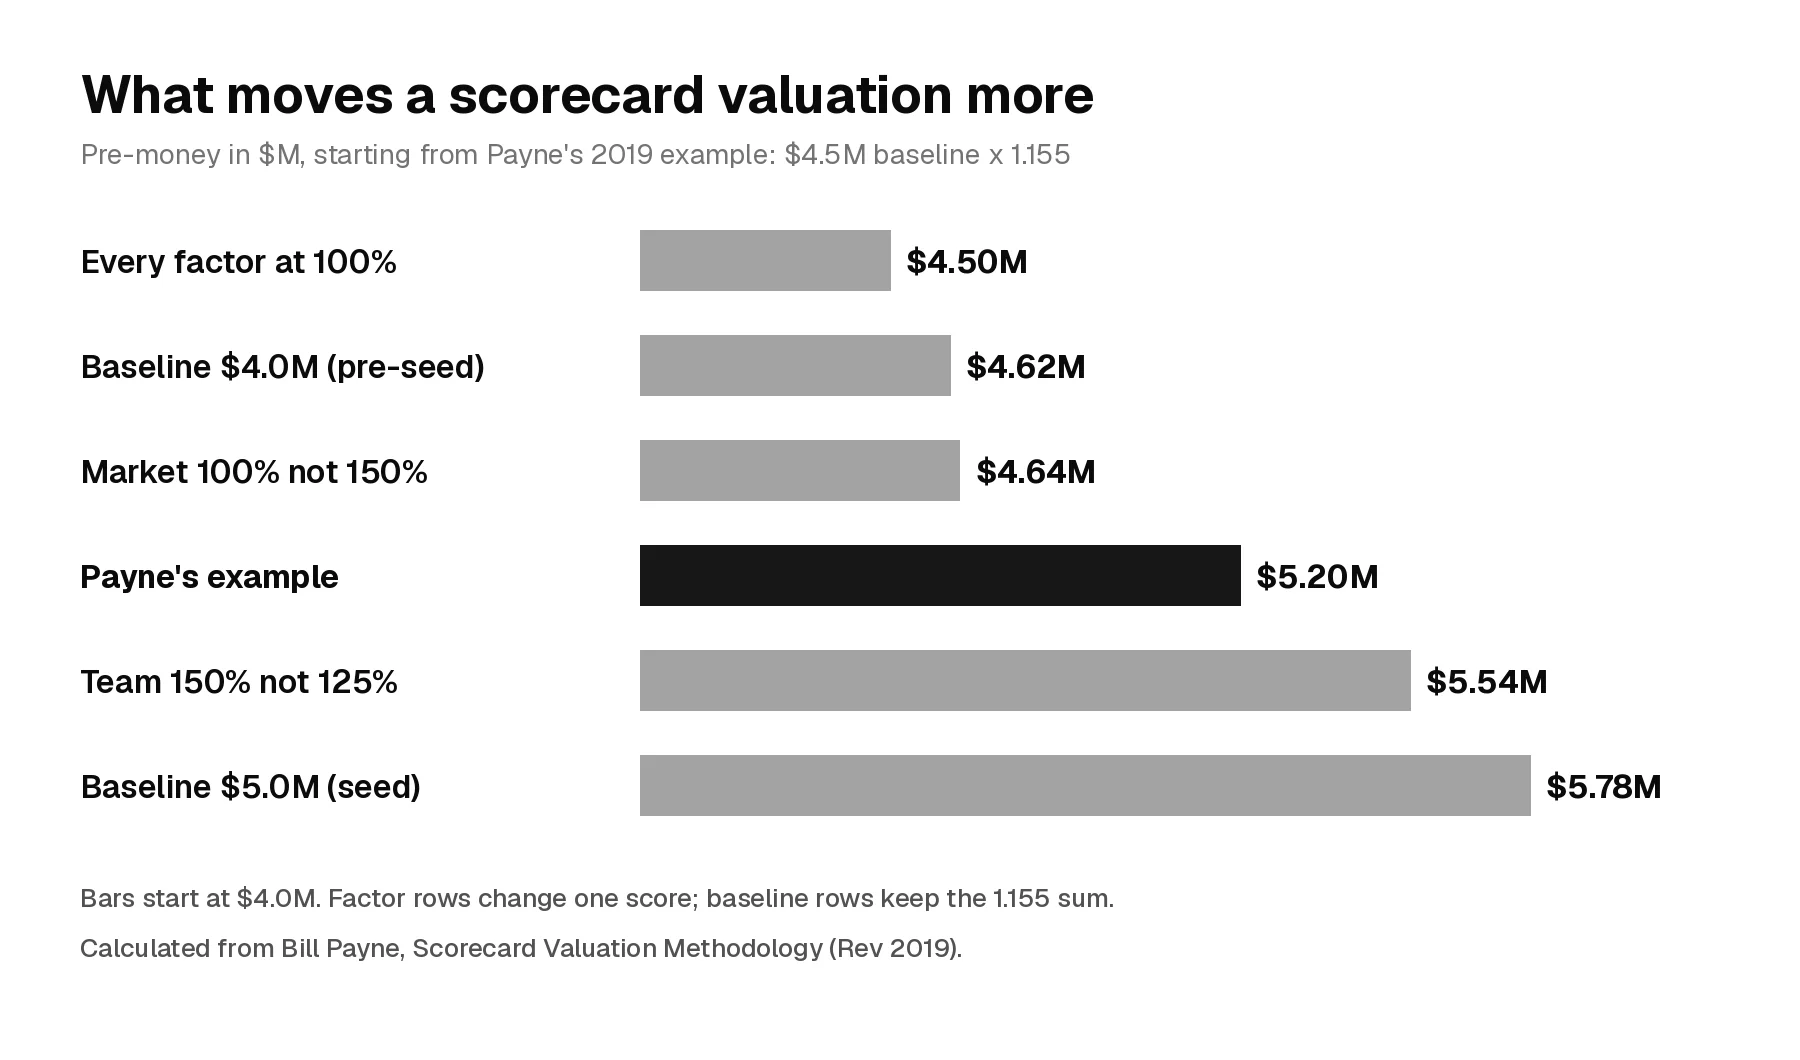
Raising the team score by 25 points, a big change in judgment, adds about $340,000. Switching the baseline from Payne's pre-seed figure to his seed figure adds about $1.16 million. When two people disagree about a scorecard valuation, the argument is usually about the baseline, not the weights.
When to use the scorecard method, and when not to
Use it when:
- The company is pre-revenue or has minimal revenue, so there are no financials to value.
- You have a credible set of recent, comparable rounds in the same region and stage.
- You need a structured way to explain why one deal deserves a higher or lower price than another, for example in a screening note or partner discussion.
- The round is a convertible note. Payne notes that many pre-seed and seed deals use convertible debt and that the method is useful for setting the cap on the note. The same logic applies to the valuation cap on a SAFE.
Use something else when:
- The company needs a large amount of capital before first revenue, the exception Payne names for some life science and energy deals.
- The company has revenue and a forecast you can defend. A return-based method such as the venture capital method or a scenario model such as the First Chicago method ties the price to exit outcomes.
- There are no good comparables. A scorecard without a reliable baseline is a guess with a table attached.
Common mistakes
- Adding percentages to the baseline. The scores are percentages of a typical deal, multiplied by weights and summed. Adding "+30% for team, +20% for market" to the baseline double counts the weights and inflates the result.
- Using the wrong-stage baseline. A priced-seed median applied to a pre-revenue company can more than triple the answer, as the example above shows.
- Scoring the team twice. Founder strength belongs in the team factor. If it also lifts "other", it is counted twice.
- Treating the output as precise. Payne's own worksheet is meant to tell an investor whether a company belongs near the top or the bottom of a reasonable range, not to give a tidy dollar figure.
- Ignoring ownership and dilution. The method gives a pre-money number. What an investor owns after the round, and after later rounds and the option pool, needs a cap table check.
Scorecard vs Berkus, risk factor summation and the VC method
| Method | Starting point | How it adjusts | Best fit |
|---|---|---|---|
| Scorecard | Median pre-money of comparable recent deals | Weighted scores vs a typical deal, multiplied | Pre-revenue companies with good regional comparables |
| Berkus | No market baseline | Assigns a capped dollar value to milestones such as a prototype and the team | Very early companies where only milestones can be judged |
| Risk factor summation | A baseline valuation | Adds or subtracts set amounts for a list of risk types | A second check on a scorecard result, focused on risk |
| Venture capital method | Expected exit value | Discounts back at a target return, then adjusts for dilution | Companies with a defensible path to an exit value |
| First Chicago method | Three exit scenarios | Probability-weights the scenario values | Companies where outcomes split into clear cases |
The scorecard is the only one of these that starts from what the market is paying today. That makes it a useful cross-check on return-based methods: if the VC method says a company is worth twice what comparable rounds are pricing at, one of the inputs needs another look.
How VC analysts use the scorecard method
At a seed fund or an angel group, the scorecard rarely sets the price by itself. The founder or a lead investor usually proposes terms. The analyst's job is to check whether those terms are in line with the market and to show why. The scorecard is a fast way to do that in a screening note or investment memo:
- State the baseline and its source. Name the stage, region and date of the comparables. This is the line a partner will challenge first.
- Score with evidence. Tie each score to something found in due diligence, such as the team's prior roles or the size of the market. The team factor overlaps with founder-market fit, so say how you scored it.
- Show the range. Give the result at a low and a high baseline, not one number.
- Compare with the proposed price. If the proposed pre-money is well above the scorecard range, say which factor would have to be stronger to justify it.
How to answer a scorecard question in a VC interview
When interviewers ask about the method, they are usually testing whether you understand that early-stage valuation is relative pricing, not a forecast. A strong answer is short:
"The scorecard method takes the median pre-money of comparable pre-revenue deals in the region, scores the company against a typical deal on seven weighted factors, team and market weighted heaviest, and multiplies the baseline by the weighted sum. An average company comes out at the baseline. The weights matter less than the baseline: moving from a pre-seed to a seed comparable set moves the answer far more than changing any one score, so I would start by asking which deals the baseline comes from."
If you get a case study interview with a pre-revenue company, show the formula, use a stated baseline, and give a range. For more practice questions, see venture capital interview questions.
FAQ
Who created the scorecard valuation method?
Bill Payne, an angel investor with Frontier Angels. He first wrote it up in 2001 and revised it several times, most recently in a 2019 version published by the Angel Capital Association.
What are the scorecard method weights?
Management team up to 30%, size of the opportunity 25%, product or technology 15%, competitive environment 10%, marketing and sales channels 10%, need for additional investment 5%, and other factors 5%.
Does the scorecard method give a pre-money or post-money valuation?
Pre-money. Add the new investment to get the post-money valuation.
Can the scorecard method be used for a startup with revenue?
It is designed for pre-revenue or minimal-revenue companies. Once a company has revenue and a forecast, methods tied to exit value or revenue multiples usually fit better.
What baseline should I use for the scorecard method?
The median pre-money valuation of comparable recent rounds at the same stage and in the same region. National data works as a fallback, but check the stage: a broad seed median sits well above pre-revenue angel pricing.
Is the scorecard method the same as the Berkus method?
No. Berkus adds capped dollar amounts for milestones without a market baseline. The scorecard starts from what comparable companies raised at and adjusts it.
Find roles at VC firms
Valuation questions like this come up most at seed funds and angel networks. To see which firms are hiring analysts and associates, browse the VC firm directory and open venture capital jobs. To get new roles by email, create a free account. To learn the return-based method that sits alongside this one, read the guide to the venture capital method.
Related posts
Exit multiple formula, a worked DCF terminal value example with a sensitivity grid, the implied growth cross-check, January 2026 industry multiples, and how VC investors use exit multiples.
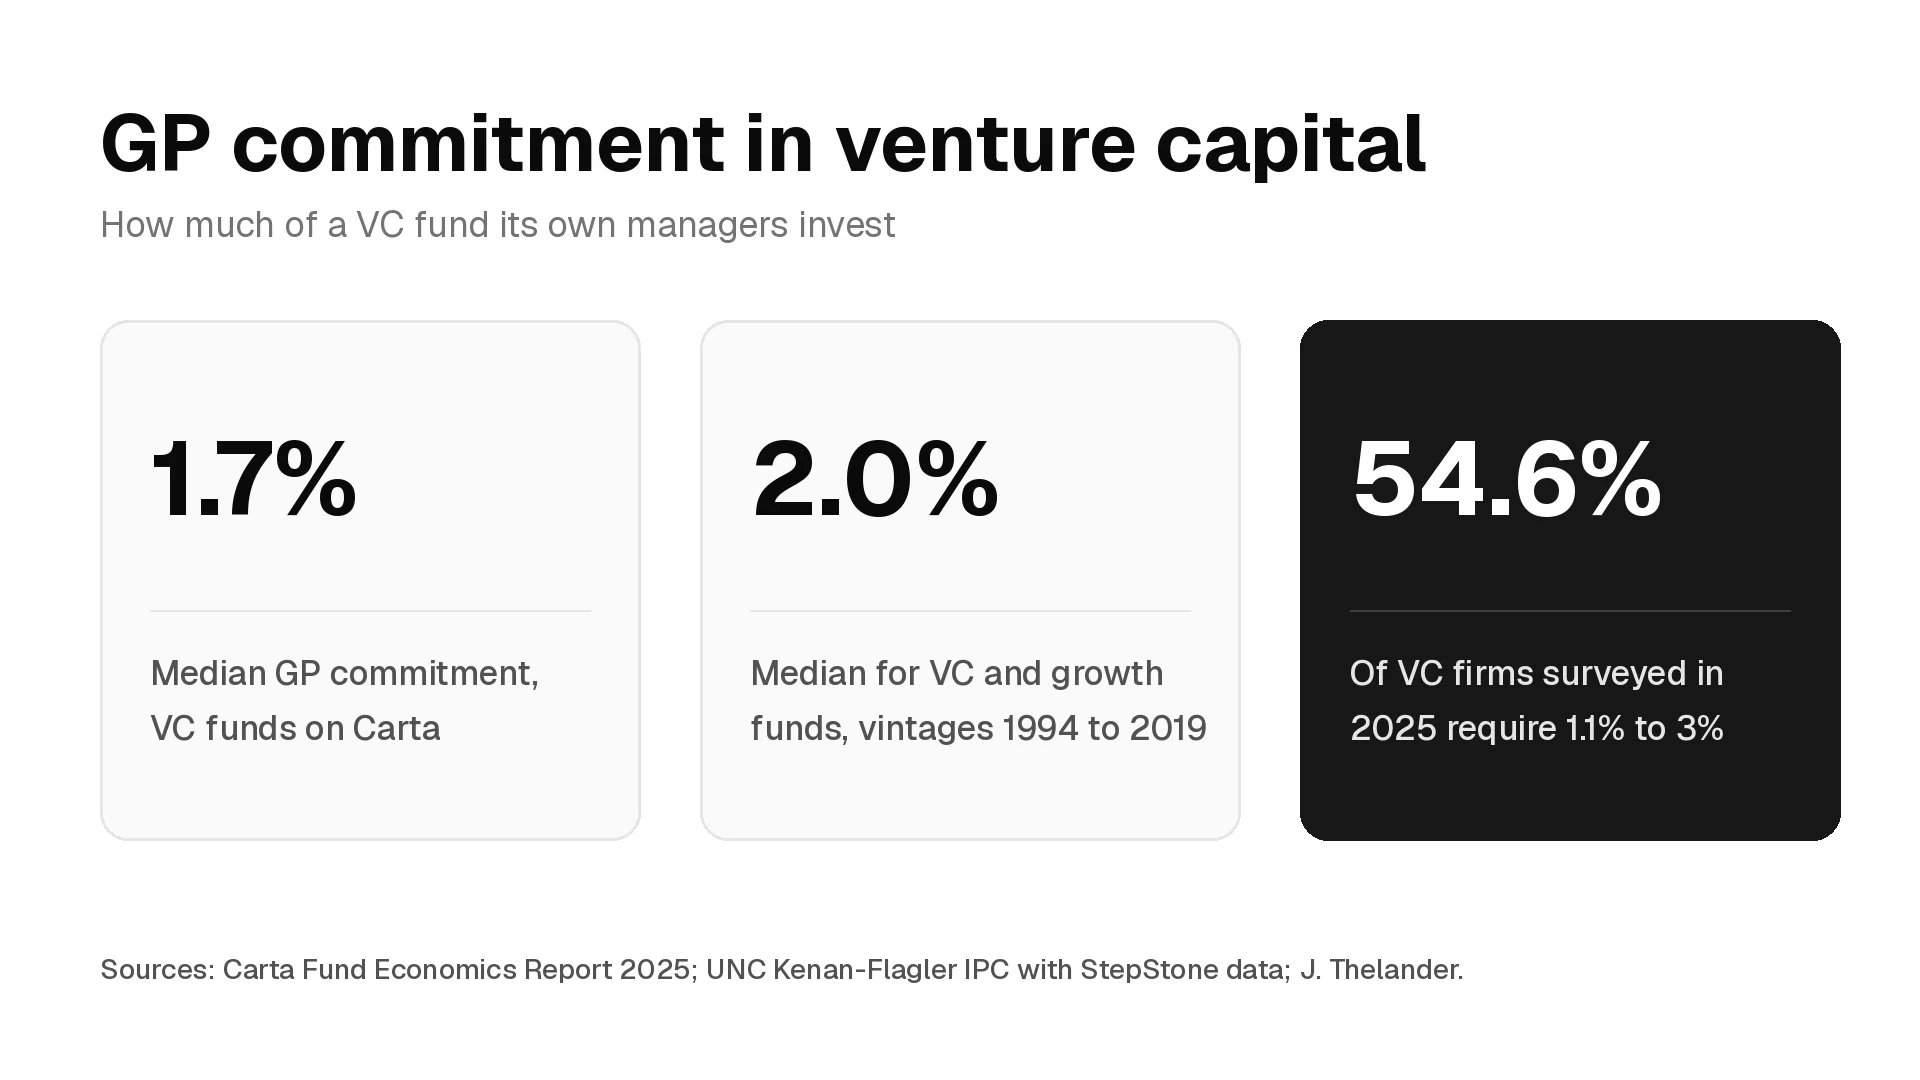
What a GP commitment is, how large it is in venture capital, how GPs fund it, where it sits in the LPA, what the returns evidence says, how firms split it across partners and principals, and what to ask before you accept a role with carry.
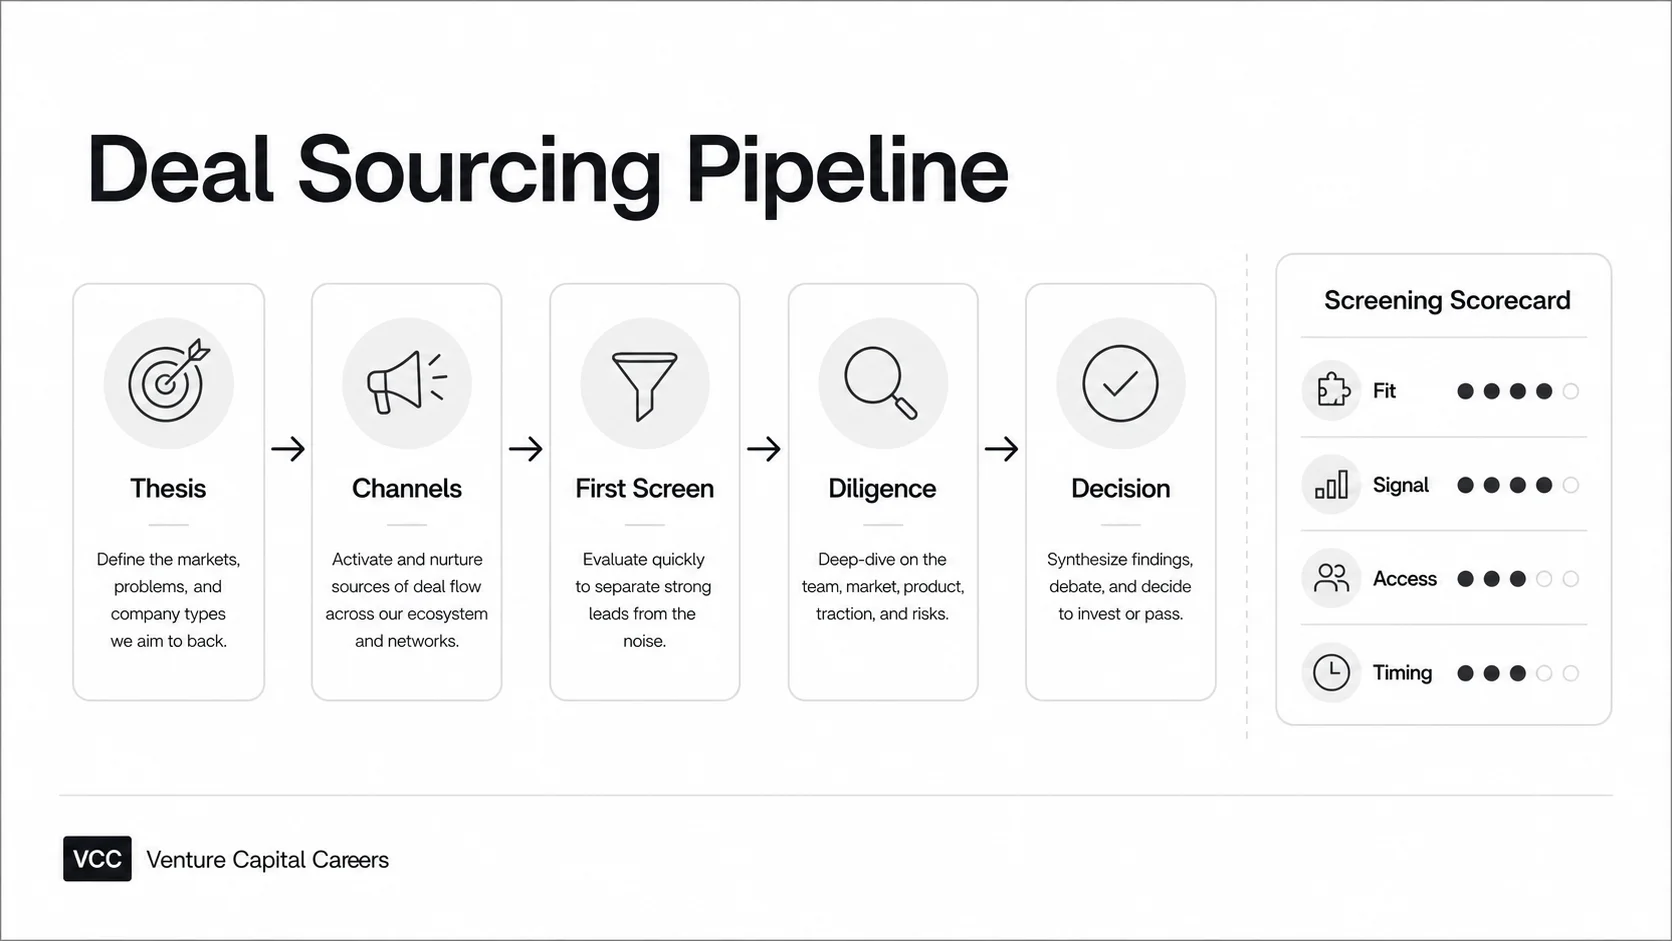
Most closed VC deals start with a relationship. See where deals come from by stage, how to work each sourcing channel, which signals show up early, and how analysts run a weekly sourcing process.