Exit Multiple: Overview, Terminal Value, and Perpetual Growth Method
Exit multiple estimates terminal value in a DCF and measures returns at sale. Here's the formula, a worked example, and how to set assumptions when multiples compress.
An exit multiple is a valuation ratio applied when a company is sold or when you need to estimate what it will be worth at the end of a forecast. In a discounted cash flow (DCF) model, it sets terminal value — often 60%–75% of total enterprise value. In private equity and venture capital, it also measures returns: sale price divided by a financial metric like EBITDA or revenue.
The same term shows up in two places analysts and associates touch constantly: the last row of a DCF and the return bridge in an investment memo. Getting the multiple right matters because small changes in terminal assumptions swing entire valuations.
What is an exit multiple?
At exit, investors express value as a multiple of earnings or revenue:
Exit multiple = Exit value ÷ Financial metric
Common denominators:
| Metric | Typical use | Example |
|---|---|---|
| EV / EBITDA | Mature, profitable companies; PE buyouts | $480M EV ÷ $60M EBITDA = 8.0x |
| EV / Revenue | High-growth, pre-profit SaaS and venture-backed startups | $150M EV ÷ $60M revenue = 2.5x |
| Equity value / Net income | Public comps, some growth equity work | Less common in early-stage VC |
In venture capital, exit multiple often answers a simpler question: if this company sells for $X, how many times do I get back my invested capital? A $100M exit on $20M invested is a 5.0x money-on-money return — a different framing of the same idea.
In private equity, exit multiple also drives multiple expansion — buying at one EBITDA multiple and selling at a higher one. That source of return has weakened since 2022, which matters when you set terminal assumptions today.
Exit multiple formula and calculation
Terminal value in a DCF
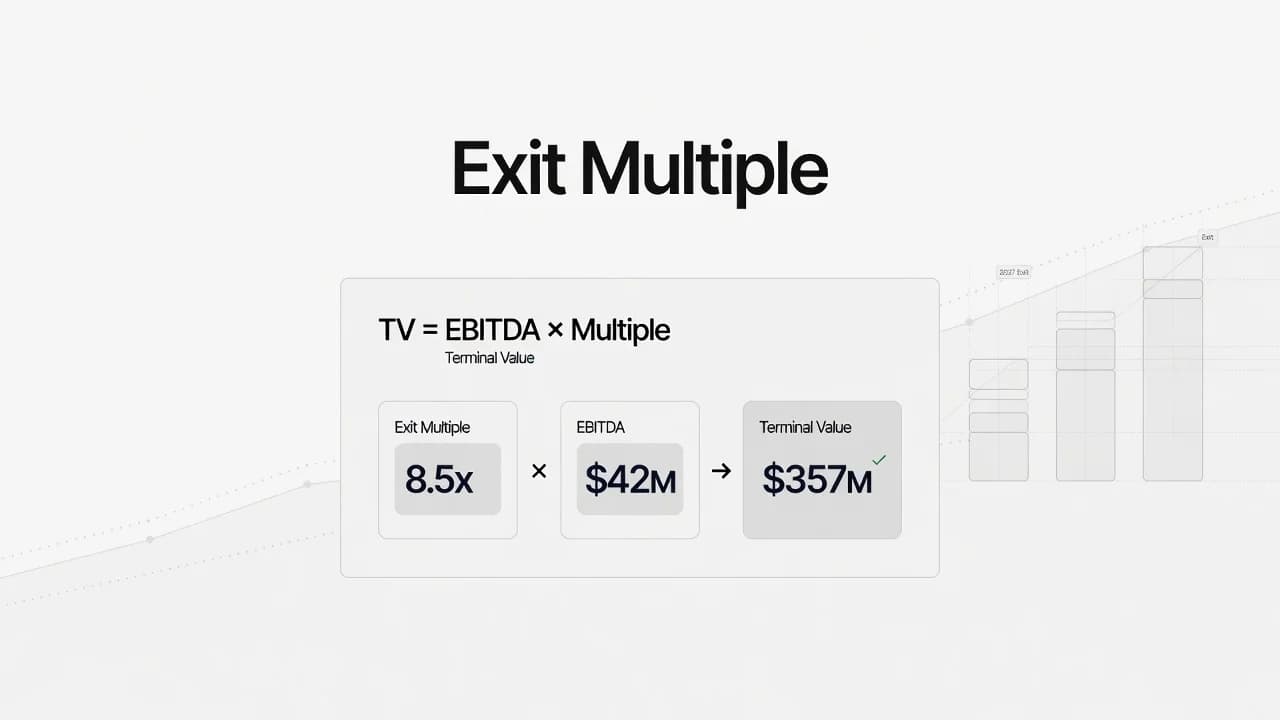
The exit multiple method estimates terminal value by applying a market multiple to a final-year metric:
Terminal Value = Final Year EBITDA × Exit Multiple
Then discount terminal value to the present:
PV of Terminal Value = Terminal Value ÷ (1 + Discount Rate)^n
Where *n* is the number of years from today to the terminal year. Use WACC as the discount rate when you are discounting unlevered free cash flows to enterprise value.
Worked example
Assume a five-year explicit forecast ending in Year 5:
| Item | Value |
|---|---|
| Year 5 EBITDA | $60M |
| Exit multiple assumption | 8.0x |
| Discount rate (WACC) | 10% |
Step 1 — Terminal value in Year 5: $60M × 8.0x = $480M
Step 2 — Present value of terminal value: $480M ÷ (1.10)^5 = $298M
Add the PV of Years 1–5 free cash flows (say, $127M in this illustration) and you get ~$425M enterprise value. Wall Street Prep's terminal value walkthrough uses a similar structure; the point is that terminal value dominates the output, so the multiple assumption deserves scrutiny.
Money-on-money exit multiple (PE/VC returns)
For fund returns, the math is direct:
Exit multiple (MoM) = Realized proceeds ÷ Invested capital
Invest $10M, receive $35M at exit → 3.5x MoM. Associates build these bridges in IC memos alongside IRR and DPI.
Exit multiple method vs perpetuity growth method
DCF models typically end with one of two terminal value approaches:
| Exit multiple method | Perpetuity growth (Gordon growth) method | |
|---|---|---|
| Formula | TV = Final Year EBITDA × Multiple | TV = [Final Year FCF × (1 + g)] ÷ (WACC − g) |
| Inputs | Comps, precedent transactions | Long-term growth rate *g* (often 2%–4%) |
| Strength | Market-anchored, easy to explain | Pure cash-flow logic, no relative valuation |
| Weakness | Imports market pricing into intrinsic model | Sensitive to *g*; easy to overstate |
Neither method is "correct" on its own. Practitioners run both and cross-check.
Sanity checks between methods
If you used perpetuity growth and want the implied multiple:
Implied Exit Multiple = Unadjusted Terminal Value ÷ Final Year EBITDA
If you used an exit multiple and want the implied perpetual growth rate:
Implied Growth Rate = (WACC − Final Year FCF ÷ Terminal Value) ÷ (1 + Final Year FCF ÷ Terminal Value)
When the implied multiple and your comps cluster are far apart — or implied growth exceeds GDP-like rates — revisit assumptions before the memo goes to committee.
How to choose an exit multiple assumption
Picking a multiple is not a median lookup exercise. Three inputs matter most:
1. Comparable companies and transactions
Start with trading multiples and precedent M&A for companies with similar growth, margin, and capital intensity. Match stage: a Series B SaaS company belongs in a different comp set than a PE-backed industrial roll-up.
2. Growth durability
For high-growth firms, expected revenue growth explains a large share of observed EV/Revenue variation. CFA Institute research published in March 2026 finds that expected one-year revenue growth explains roughly 55% of multiple variation among companies with 10-year CAGRs above 30%. Higher durable growth supports a higher exit multiple — but only if margins and capital needs support it.
3. Interest rate regime
Multiples are sensitive to the risk-free rate because high-growth cash flows sit far in the future. Anchoring to 2020–2021 median multiples without adjusting for today's rate environment risks overstating terminal value. Form a view on rates at your assumed exit date, not just today's spot yield.
EV/EBITDA vs EV/Revenue: quick decision guide
| Company profile | Preferred multiple | Why |
|---|---|---|
| Profitable, stable margins | EV / EBITDA | Earnings quality is observable |
| High-growth SaaS, near breakeven | EV / Revenue | EBITDA is negative or misleading |
| PE platform with add-ons | EV / EBITDA | Lenders and buyers think in EBITDA |
| Early-stage VC | Revenue or GMV (sector-specific) | Profit metrics are not yet meaningful |
When in doubt, model both and stress-test ±1.0x on EBITDA or ±0.5x on revenue.
Navigating compressed exit multiples in PE and VC
Exit assumptions set in 2020–2021 markets are a liability in 2025–2026. Two data points frame the shift:
Multiple compression on exit. MSCI private-capital data shows that from 2022 through Q3 2024, exited buyout assets sold at lower median EBITDA multiples than assets still held in portfolios — by roughly 0.5x to 1.1x — reversing a decade-long pattern where exits typically cleared above held-asset marks. Exited companies often had stronger margin growth, which cushioned the multiple drag. Held assets with deteriorating margins and higher leverage face greater mark risk.
Deal math requires more operating performance. Bain's 2026 private equity midyear report notes that simultaneous high entry multiples and elevated financing costs put the industry's "deal cost index" in record territory. A deal that might have cleared with ~5% annual EBITDA growth in a lower-rate era may need ~12% to reach a 2.5x MOIC over five years today — with less help from multiple expansion.
Practical responses when multiples compress
- Underwrite operations, not hope for rerating. Base cases should show margin and cash-flow improvement, not only multiple expansion at exit.
- Haircut terminal multiples in DCFs and LBO models relative to peak-cycle comps; document the rate and growth view behind the haircut.
- Separate VC from PE timing. Venture exits are sparser and more winner-take-all; revenue multiples can stay elevated for category leaders even when middle-market PE EBITDA multiples compress.
- Use structured liquidity when open-market exits fail. Continuation vehicles and secondary processes are more common — but LP scrutiny on marks is tighter than before.
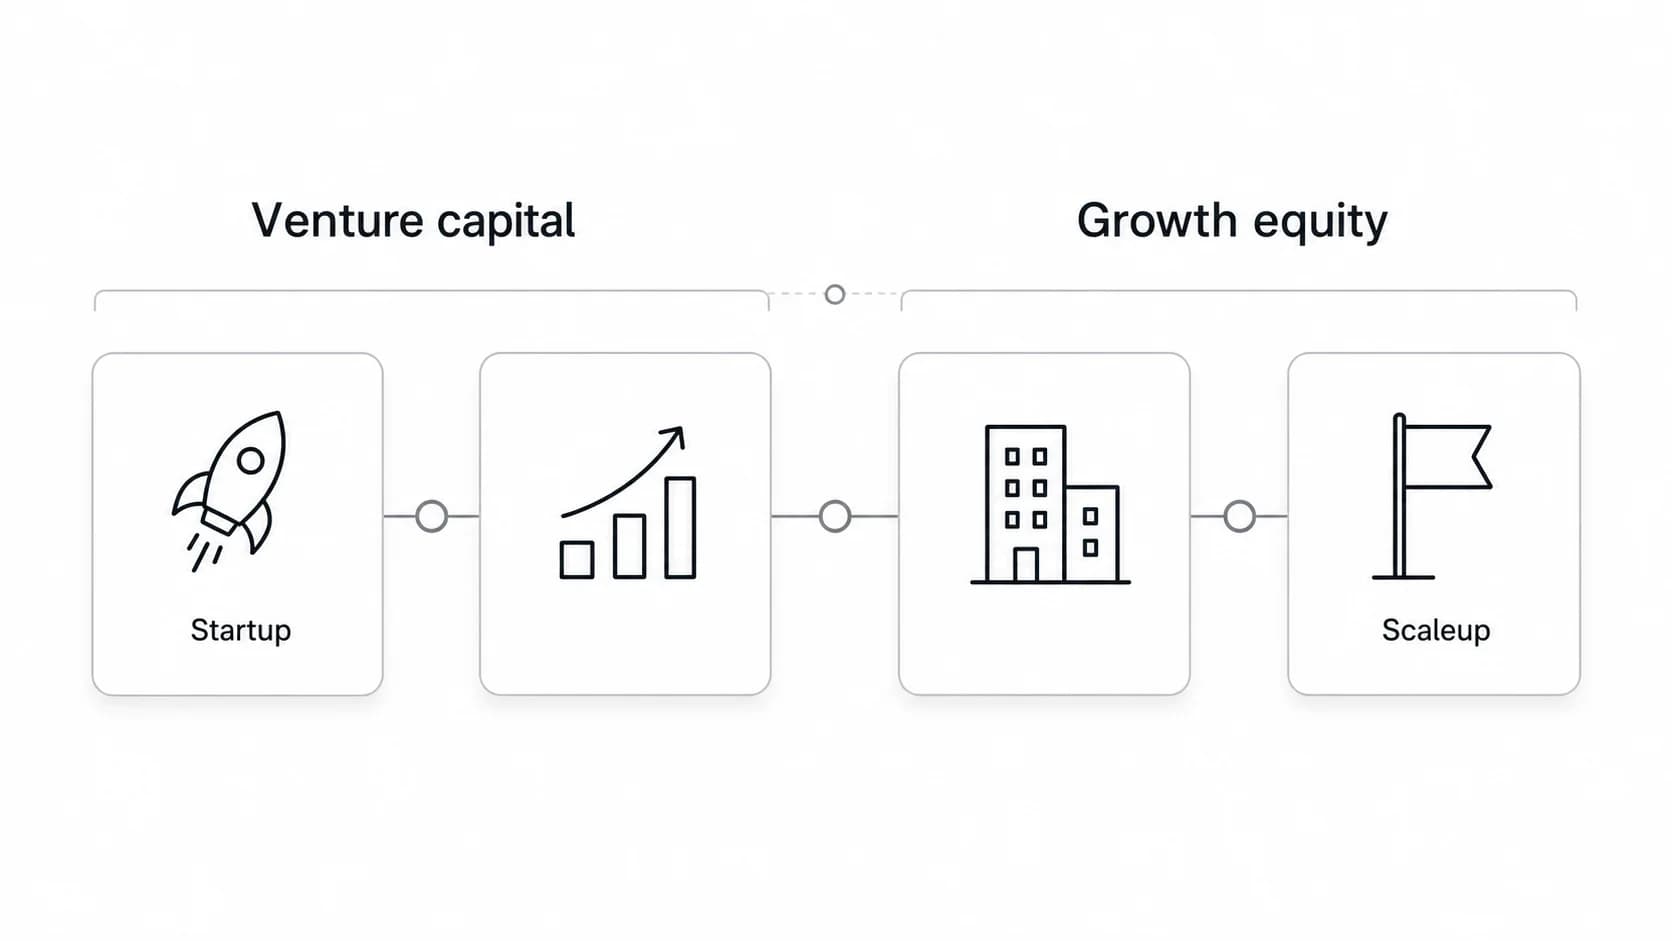
For growth-stage investors weighing how multiples differ by asset class, see growth equity vs venture capital and private equity vs venture capital.
Where exit multiples show up in VC and PE careers
If you are targeting venture capital analyst or associate roles, expect exit multiples in:
- Comps and precedent transaction tables — building and defending the multiple range in a memo
- DCF and LBO support — terminal value is where seniors probe your judgment
- Return bridges — entry multiple, exit multiple, and EBITDA growth decomposition
- Interview cases — "What exit multiple would you use and why?" tests whether you link comps, growth, and rates
The work is less about memorizing formulas and more about defending assumptions. Partners will ask why your exit multiple is 8.0x instead of 7.0x when the comp median is 9.0x but rates are higher and growth is slower. Your answer should cite growth durability, margin trajectory, and the rate environment — not "that's what the spreadsheet defaults to."
For broader context on how funds generate returns, read how venture capital works. If you are mapping where valuation skills fit in a fund hierarchy, start with the venture capital career path guide.
FAQs
What is the exit multiple formula?
For DCF terminal value: Terminal Value = Final Year EBITDA × Exit Multiple. For investment returns: Exit Multiple = Sale Price ÷ Invested Capital (or sale value ÷ EBITDA/revenue, depending on context).
How do you calculate exit multiple from a DCF?
Multiply your final forecast year's EBITDA (or revenue) by your chosen multiple to get terminal value in that year. Discount terminal value back to today using WACC. Sum with the PV of explicit-period cash flows for enterprise value.
What is a good exit multiple?
There is no universal number. Mature PE buyouts in recent years often clear between 6x–10x EBITDA, but sector, growth, and rate environment move the range. High-growth SaaS may trade on EV/Revenue instead. Always anchor to current comps and haircut for compression when marks look stale.
Exit multiple method vs perpetuity growth — which is better?
Use both. Exit multiple is market-anchored and easy to defend in memos; perpetuity growth is cash-flow pure. Cross-check implied growth against GDP-like rates and implied multiples against comps. Large gaps signal an error or an aggressive assumption.
Why are private equity exit multiples compressing?
Higher rates, slower distributions, and skeptical buyers have reduced the premium exits command over held-asset marks since 2022. MSCI data shows exited assets trading below held-asset medians while held portfolios show margin pressure. Operational value creation matters more when you cannot rely on multiple expansion.
---
Exit multiples look like a single line in a model. In practice, they encode your view of growth, rates, and what the next buyer will pay. Build the formula fluency early in your career — then focus on the judgment that makes the number defensible.
If you want to apply these skills on a live deal team, browse open venture capital analyst and associate roles on Venture Capital Careers.